The Data table panel allows you to sort and filter data. Filter data to show a subset of your dataset in the map, chart, legend and data panel.

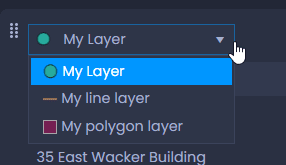
To sort and filter data, you will need to select the right layer in the data panel first if your map has multiple layers. Use the list in the top left-hand side corner of the data panel to select the layer you want to filter or sort:
If the columns you want to sort or filter by are not visible, you can select other columns to show in the data table settings ![]() in the top right-hand side corner of the data panel. See our dedicated article to learn more.
in the top right-hand side corner of the data panel. See our dedicated article to learn more.
Sort data #
Click on a column’s header to sort it. The first click will sort the data ascending ![]() , the second click will sort the data descending
, the second click will sort the data descending ![]() , and the third click will clear the sort to go back to the original order.
, and the third click will clear the sort to go back to the original order.

You can use the page navigation below the table to navigate in your table: click on the numbers to navigate to a page, and use the arrows to navigate to the next/previous page or the first/last page:

You can also change the number of items per page:
- “auto”: the number of items will change when you resize the panel to always show the maximum number of items.
- fixed number: select a fixed number of items. A scroll bar will be added to the panel to visualize all items.

Filter data #
Click on ![]() in the column header to filter the data table using this column:
in the column header to filter the data table using this column:
- if your column has a small number of different values, you can check the values you want and click “Filter“:

- if your column has a lot of different values, you will need to use the conditional filter. Choose one of the conditions (Is equal to, Is not equal to, Is greater than or equal to, Is greater than, Is less than or equal to, Is less than, Is null, Is not null), enter the value and click “Filter“. You can also set a secondary condition with “And” or “Or”.

At what thresholds is the conditional filter used?
- Numeric data: if there are more than 10 different values, the conditional filter is used.
- String data: if there are more than 50 different values, the conditional filter is used.
- Date/Time data: if there are more than 20 different values, the conditional filter is used.
When a column is filtered, the filter icon in the header will be blue: ![]() . You can set multiple filters on different columns. Click on
. You can set multiple filters on different columns. Click on ![]() to clear all filters on the layer.
to clear all filters on the layer.
Please note that data cannot be filtered in the Selection tab. See our dedicated article on how to select data.
Save filters in the slide #
Map Creators with edit permissions on the map can save filters in the current slide.
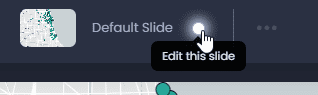
To save your filters, switch to the edit mode of your slide if you are not currently editing it:
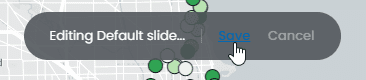
Then, save your changes by clicking “Save” or the green dot in the top bar ![]() :
:
By saving your slide, all other slide elements will be saved. See what other elements will be saved here.