Story Maps: Powerful Communication Tools for Municipal Issues and Opportunities

Table of Contents

City councillors play a vital role in addressing and communicating municipal issues and opportunities. However, they often face numerous challenges when it comes to effectively conveying complex information, engaging diverse audiences, managing limited resources, and balancing transparency with confidentiality.

This blog post explores these challenges and highlights how maps and stories, coupled with web mapping technology, can help city councillors overcome these hurdles and communicate municipal issues more effectively.

Challenges in Communicating Municipal Issues

Some of the challenges that city councillors encounter when presenting municipal proposals include the following:

City counselor challenges

Complex and technical information

Municipal issues involve intricate concepts and technical details, such as budgets, policies, and regulations. City councillors face the challenge of conveying this information in a manner that is easily understandable to diverse audiences with varying levels of knowledge and expertise.

Diverse and large audiences

City councillors represent constituents with diverse interests, needs, and communication preferences. Effectively communicating with such a broad audience requires adapting communication styles and content to resonate with different segments, including various age groups, cultural backgrounds, and education levels.

Balancing transparency and confidentiality

City councillors must navigate the delicate balance between providing transparent information to constituents and respecting confidentiality requirements and legal constraints. Sensitive information related to personnel matters, legal issues, or private data may limit the extent to which city councillors can disclose certain details to the public.

Limited attention and engagement

Constituents may have limited attention spans and may not actively engage with municipal issues. City councillors must find creative ways to capture their constituents' attention and keep them engaged. Visual aids, storytelling techniques, and other engaging communication strategies can be instrumental in making the information more accessible and interesting.

Limited time and resources

Elected officials often face time constraints and limited resources for communication efforts. Balancing their multiple responsibilities while effectively communicating municipal issues can be challenging. Additionally, limited resources, such as budget, staff, and technology, can impact the implementation of effective communication strategies.

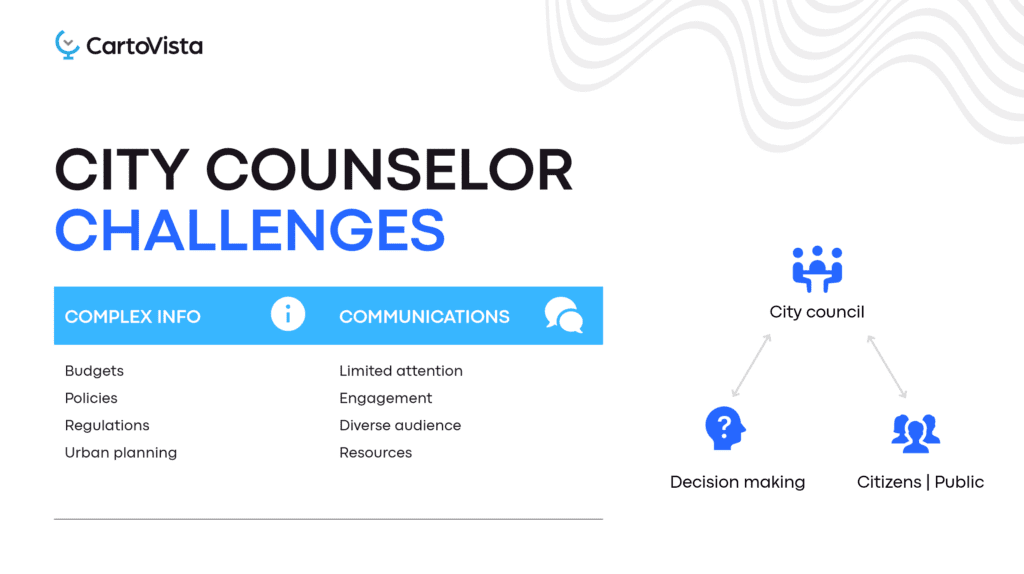
Managing conflicting perspectives and opinions

Municipal issues often involve differing viewpoints, opinions, and interests among constituents, stakeholders, and other parties. Elected officials must communicate and navigate these conflicting perspectives while maintaining professionalism and impartiality. Managing public expectations, addressing concerns, and finding common ground can be challenging in the communication of municipal issues.

cartovista logo

Start creating your first Story Map for free today!

The Power of Maps and Stories

To overcome these challenges, elected officials can leverage the power of maps and stories. There are three key ways in which Story Maps can help deliver an engaging presentation that inspires action.

1. Maps help overcome communication challenges

city-gouvernement-cart-vista-map (1)

Maps serve as visual representations of data and are commonly used in municipal districts. They highlight relationships between various elements, making it easier to understand complex information. Maps create a connection with the user and provide real-world context, enhancing engagement and comprehension.

2. Stories provide resonance and impact

Stories have a unique ability to provide rich context, explain complex concepts, and engage the audience on an emotional level. They help bring information to life and ensure that it is easily understood, remembered, and embraced by constituents.

3. Democratizing data visualization with GIS mapping technology

cloud based technology

Cloud-based web mapping technology has democratized data visualization, making it accessible and user-friendly. Previously, creating dynamic and captivating presentations required expertise from Geographic Information System (GIS) professionals. Now, easy-to-use web-based applications allow users to combine various data sources, such as GIS data, municipal system data, and personal spreadsheet data, to create compelling visual presentations.

Municipal Story Maps Presentation Examples

Let's explore a few examples that illustrate how maps and stories can be leveraged to communicate municipal issues effectively.

1. Le Plateau Infrastructure Project Overview

The Plateau Story Map was used to present a visual summary of all the municipal projects in the district. The map displays the ward boundaries and provides a comprehensive overview of the projects, including their locations and types represented by colours in the legend.

Picture4

Detailed information on each project is easily accessible for answering questions. The accompanying story panel provides a brief explanation, summary, and pictures to enhance understanding.

The StoryMap also showcases citizen feedback and how it was addressed. Colour-coded markers represent the main issues raised in meetings, with a clear distinction between individual and public ward meetings.

Picture5

The map also highlights the status of related projects, including completed projects with images and examples, as well as planned projects with locations and key dates for future reference. Budget information can be integrated and represented using colour. on public and private properties.

Picture6

A summary concludes the map presentation, offering a comprehensive view of all projects related to citizen consultations.

2. Economic Development in Le Plateau

The Economic Development Story Map focuses on district-related economic development and provides valuable information for establishing current and future businesses. It includes a registry of all existing businesses, displayed in a table format that allows for easy filtering and sorting. Different types of business are represented using colour. While the map can answer questions about existing businesses, its main focus is on new business projects.

Picture7

The first use case involves three potential restaurants, with the Story panel providing details about their business plans and the map showing their desired locations in comparison to existing restaurants.

Picture8

In the second use case, a furniture store is seeking a suitable location. The map displays vacant lots, filtered to match their criteria of 20,000 to 40,000 m². Additionally, it identifies areas within a 7-minute walking distance from existing home improvement stores, helping identify potential locations close to these stores. As a result, three potential locations are identified. This map facilitates meaningful discussions with businesses, helps them understand suitable locations, and addresses their inquiries effectively.

Picture9

3. Urban Planning in Le Plateau

The Le Plateau urban planning Story Map provides comprehensive information on land use and urban planning, showcasing current and planned developments. Key data sets featured include the year of construction, zoning regulations, land use categories, number of units, vacant land, permitted structure types, new streets, and maximum allowable number of storeys.

Picture10

The Story Map also integrates city data with information from the urban planning department, encompassing zoning details, land use classifications, number of units, and ongoing road projects. Users can easily navigate the map by searching for a specific lot number or postal code, enabling efficient access to desired locations.

Picture11
cartovista logo

Start creating your first Story Map for free today!

How to create a Story Map

Even if you are not a technical GIS expert, creating a Story Map with CartoVista is quick and easy. Once you have created your account and have logged in to the platform, here are the five easy steps to create a Story Map.

1

Import excelsheetImport a map layer from an Excel spreadsheet containing locations. The addresses will be geocoded to convert them into map coordinates.

2

Customize map styleCustomize the map style by modifying the shape or colour of the points.

3

Remove unnecessary panelsRemove unnecessary clutter and focus on the essential information and eliminate any unnecessary panels.

4

Write your storyAdd a story panel and include supporting text to provide context and narrative.

5

Create additional slidesExpand the presentation by creating additional slides.
hero-video-carto-overlay
Play Video

By following these five steps, you can effortlessly create a concise and impactful map presentation.

cartovista logo

Start creating your first Story Map for free today!