

CartoVista has designed an interactive map, updated daily, to provide a visual overview of the situation.
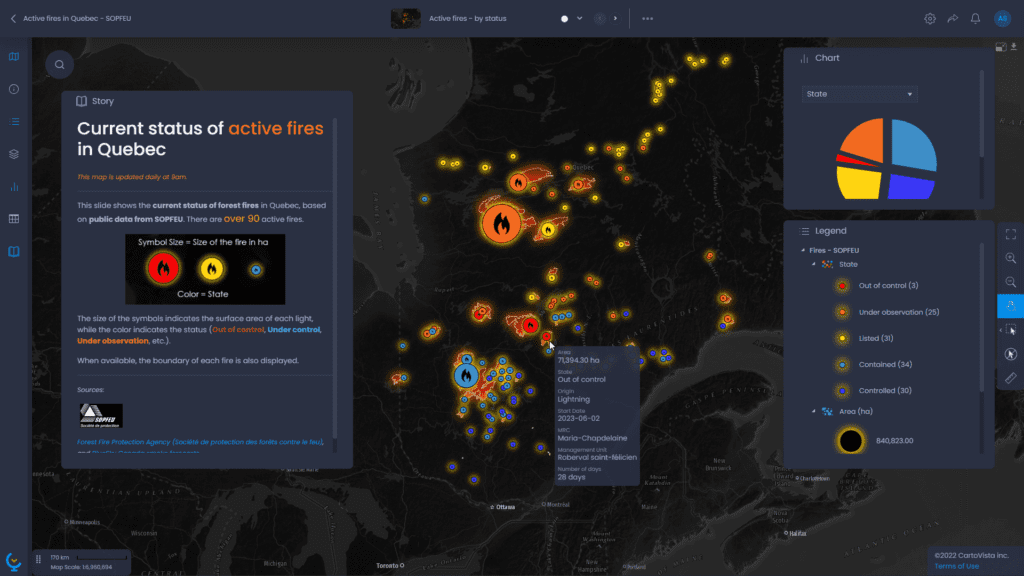
Forest fire status
This slide shows the status of forest fires in Quebec, based on public data from SOPFEU. The size of the symbols indicates the surface area of each fire, while the color represents the current status (Out of control, Under control, Under observation, etc.). When available, the outline of each traffic light is also displayed. This visualization provides a better understanding of the extent and status of forest fires across the province.
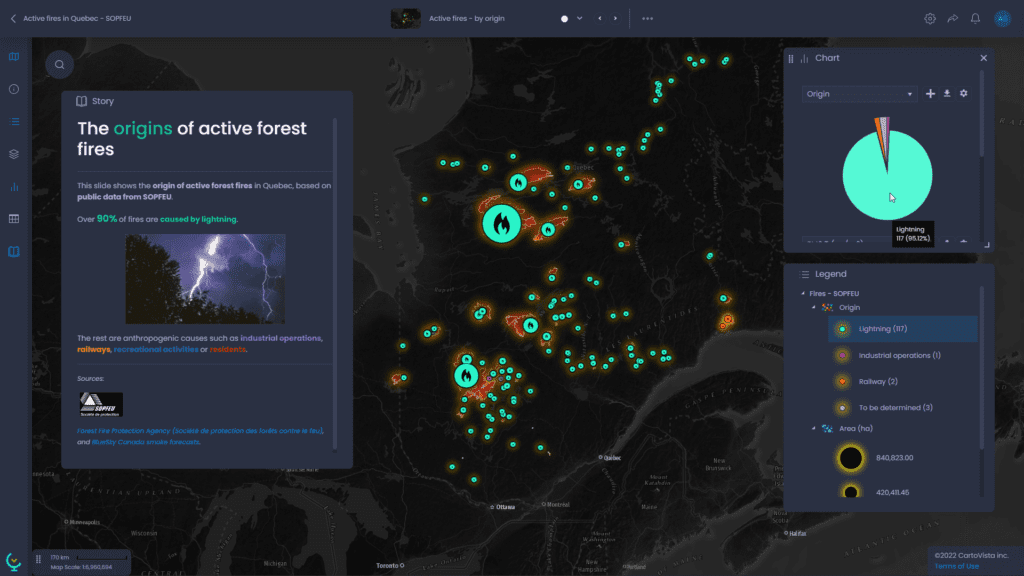
Origin of active forest fires
Another slide shows the origin of active forest fires in Quebec. It is interesting to note that over 90% of fires are caused by lightning, a natural phenomenon. The remainder of fires are attributable to anthropogenic causes such as industrial operations, railroads, recreational activities or irresponsible behavior by residents. Understanding the causes of fires is crucial to implementing effective prevention measures.
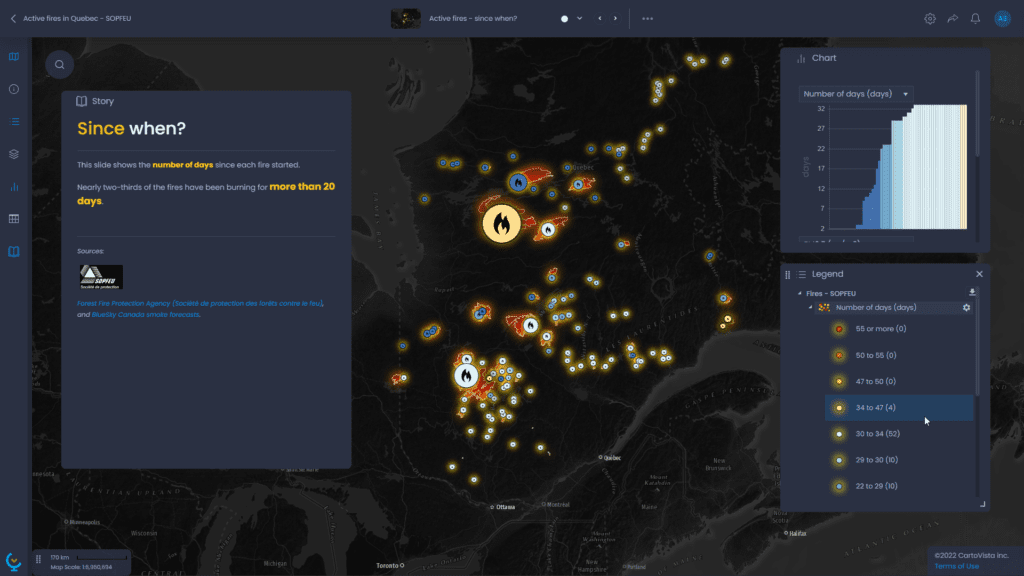
Fire duration
This theme shows the number of days elapsed since the start of each fire. Nearly two-thirds of the fires in progress have been burning for more than 20 days, underlining the persistence of the situation and the challenges facing fire-fighting teams. This data highlights the importance of rapid, effective intervention to contain fires as quickly as possible.
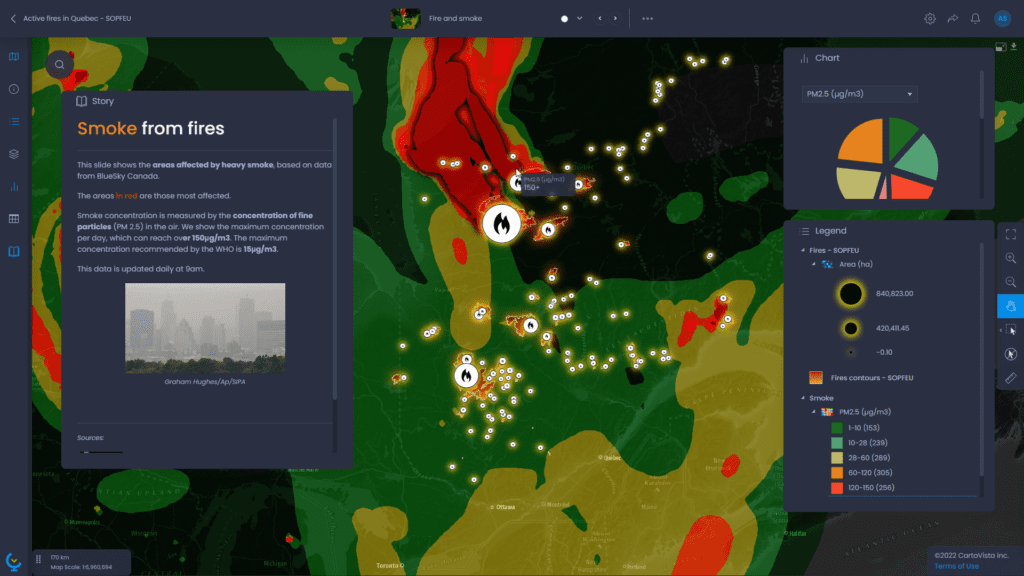
Smoke impact
This supplementary theme presents the areas affected by heavy smoke, based on data from BlueSky Canada. Areas in red indicate those most affected. Smoke concentration is measured in terms of fine particles (PM 2.5) in the air. The graph shows the maximum concentration per day, which can reach over 150μg/m3. It should be noted that the maximum concentration recommended by OSM is 15μg/m3, highlighting potential air quality problems in areas affected by forest fires.
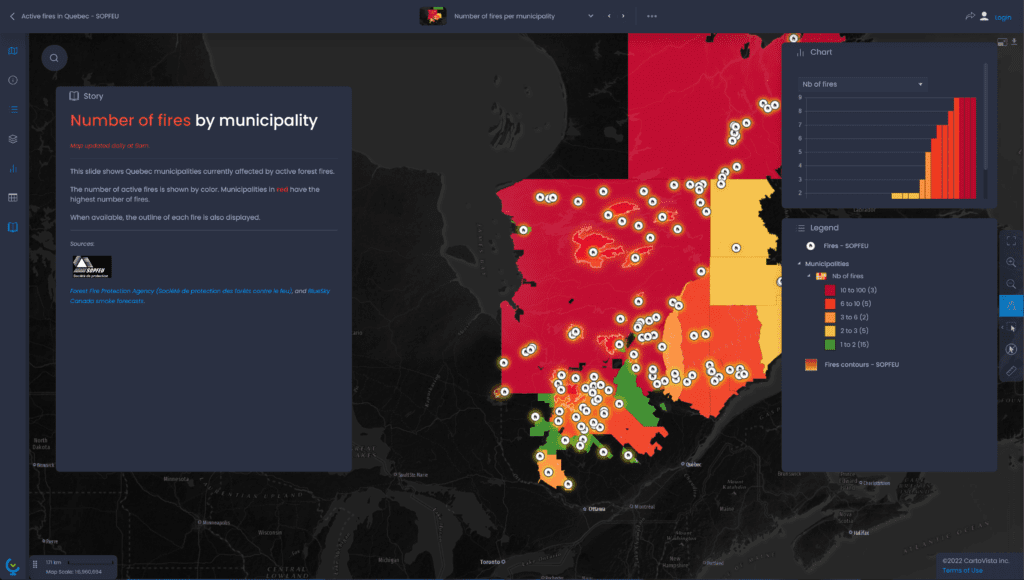
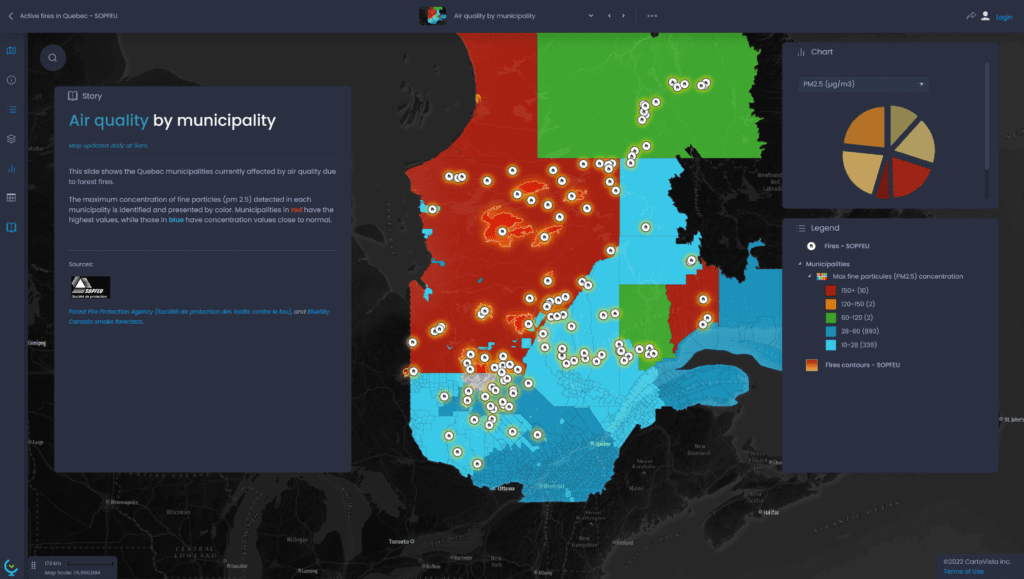
Number of fires and air quality by municipality
These two slides visually present the number of fires and the air quality index by municipality in color-coded figures.
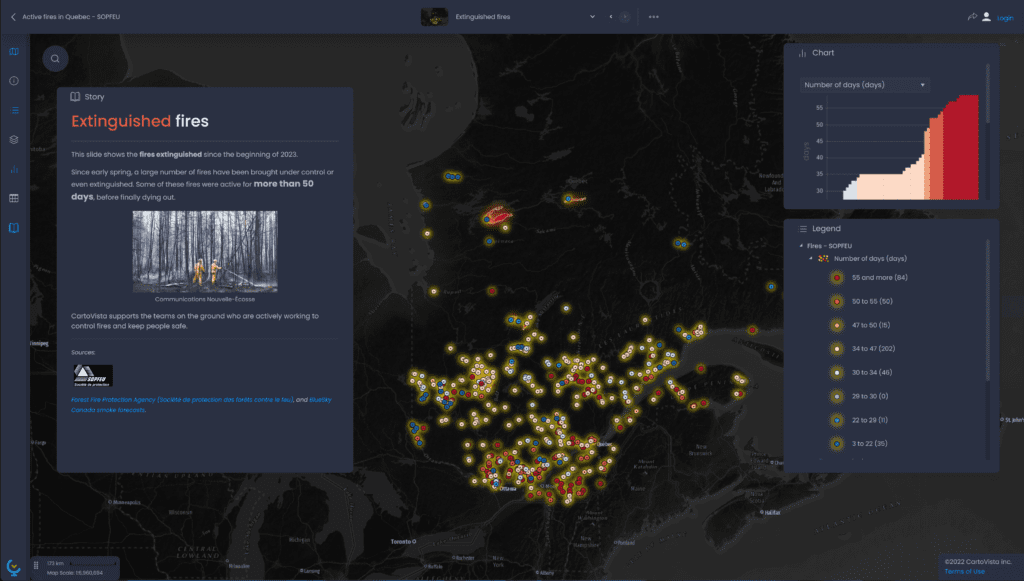
Fires out
Since early spring, a significant number of fires have been brought under control or even extinguished. Some of these fires were active for more than 50 days, before being extinguished.
Conclusion
The forest fire situation in Quebec continues to give cause for concern. Fire-fighting teams, in collaboration with SOPFEU, continue to deploy considerable efforts to contain fires and protect communities. It is crucial to remain vigilant, to follow the instructions of the authorities and to take appropriate preventive measures to minimize the risk of fire. CartoVista makes it possible to effectively visualize the information provided by various stakeholders such as SOPFEU, who are playing an essential role in managing this crisis.
[
](https://cloud.cartovista.com/layers/maps/8b5f32/Active-fires-in-Quebec-SOPFEU)
Sources
- Société de protection des forêts contre le feu (SOPFEU) https://sopfeu.qc.ca/en/
- BlueSky Canada smoke forecasts https://firesmoke.ca/forecasts/current/
- CartoVista https://www.cartovista.com/