CartoVista, the leader in geospatial data visualization solutions, is thrilled to announce the official release of CartoVista Cloud 8.5 at the highly anticipated GeoMTL conference next week on October 18th. This latest release is set to revolutionize the way you interact with your data, offering a host of exciting features that empower users to create captivating web presentations effortlessly.
Experience story maps and web presentations like never before
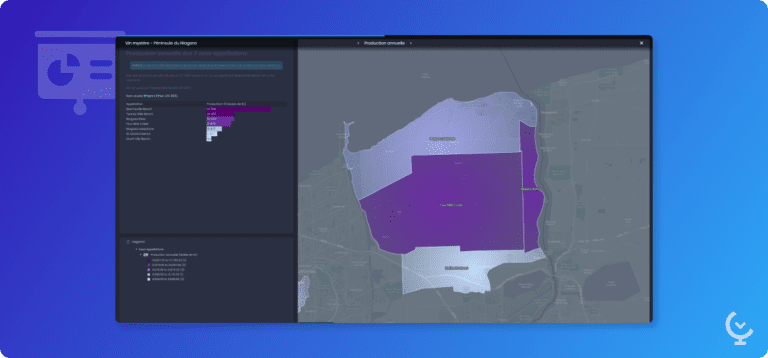
Version 8.5 is loaded with enhancements that raise the bar, turning your data into captivating web presentations that resonate powerfully. With the click of a button, users can immerse themselves in a full-screen presentation mode.
The map is turned into a slide show, where users can navigate through slides seamlessly using keyboard controls. In each slide, the fully-feature interactive web map can be enriched with rich HTML content, providing invaluable context and storytelling capabilities.
Additionally, Version 8.5 introduces slide steps, allowing you to reveal one piece of information at a time. With steps, the map and the presentation capabilities are combined for dynamic storytelling: users can easily add map links to navigate automatically to locations on the map as the story unfolds.
Raster and vector data are now even easier to work with in CartoVista
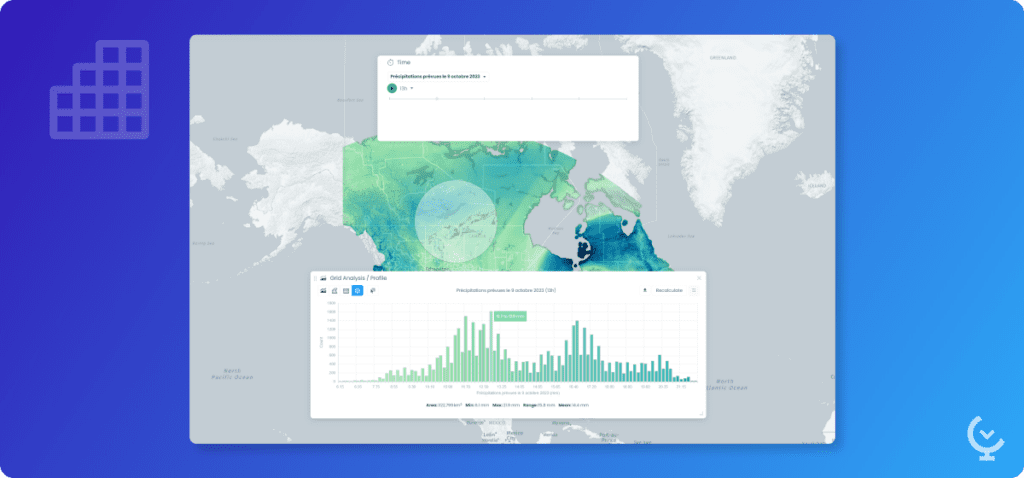
One of the remarkable breakthroughs in 8.5 is its effortless ability to upload raster imagery in GeoTiff format through a simple drag-and-drop process. Tailored to meet the needs of GIS professionals and others, including geoscientists and climate change decision-makers, this feature simplifies the management and display of single-band raster or RGB imagery. Interactive datatips and rollovers expedite data comprehension by providing immediate insights into data values and units, facilitating users’ understanding of their data with speed and precision. Additionally, users can easily create time series animations to visually track the evolution of vital geoscientific data over time. CartoVista simplifies overlaying earth observation raster data on the web, allowing for quick visualization and exploration of its relationship with other data.
Version 8.5 also includes robust tools for analyzing raster data, including a linear profile tool for creating informative profile charts, and interactive drawing areas (rectangles, circles, or polygons) that display detailed statistics in a color histogram, improving data understanding.
This release introduces support for many-to-one data relationships, ideal for time-based vector data analysis. CartoVista time-based tools allow thorough exploration and aggregation of time series data, offering simple filtering by date. The integrated time view chart and animations provide insightful representations for in-depth exploration.
Seamless integration with WMS layers
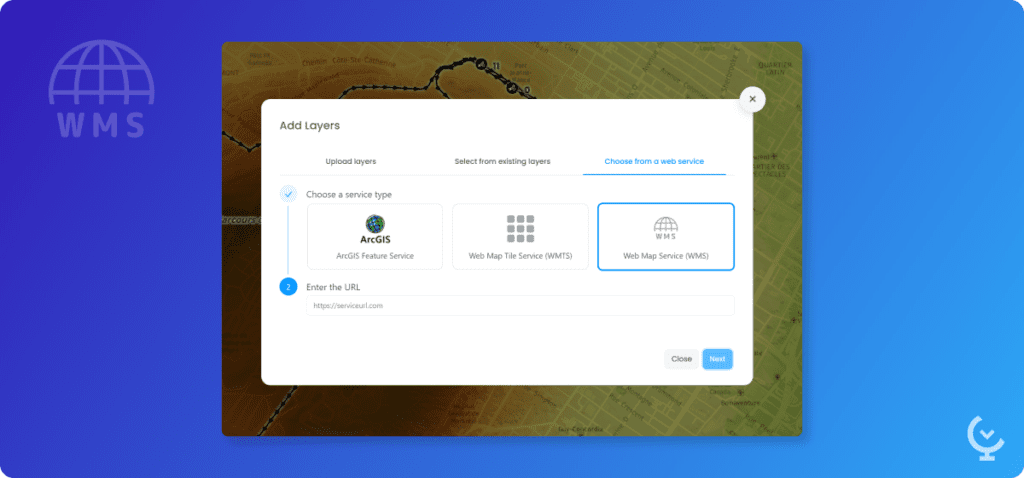
In response to user demands, CartoVista 8.5 now seamlessly integrates Web Map Service (WMS) layers. Users can effortlessly connect to desired web services and select layers for display, with support for querying and legend integration, providing enhanced map context and clarity.
Powerful AI at your fingertips
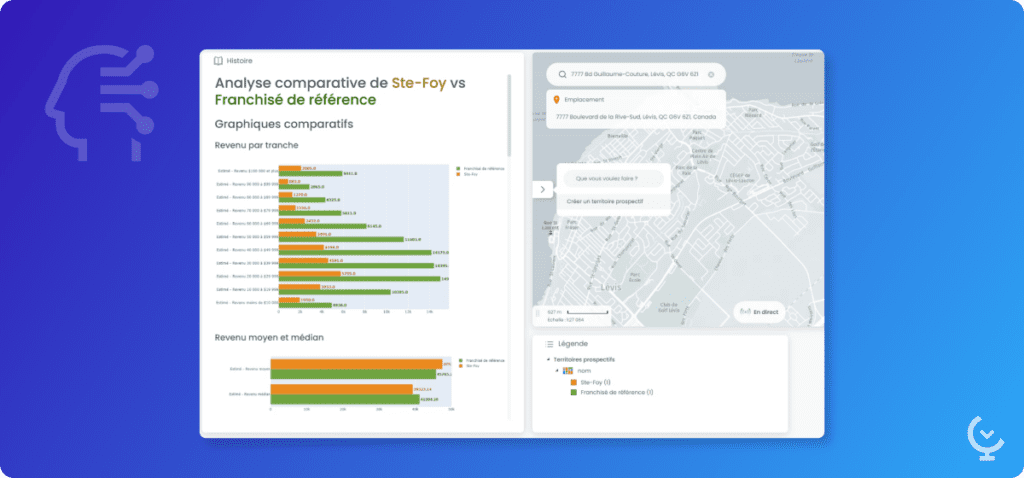
Finally, a groundbreaking feature in CartoVista 8.5 is the introduction of geoprocessing actions. These actions are designed to execute specific tasks that answer complex business questions with the use of AI through scripting in languages like Python. Whether it’s analyzing potential franchise locations or tackling intricate data science challenges, these actions offer custom user interactions. Integrated into the user interface, these context-sensitive actions provide flexibility and convenience, simplifying complex problems with an exceptional user-friendly experience.
A final word
“We are thrilled to introduce CartoVista Cloud 8.5 to our valued customer base,” says Dany Bouchard, CEO/Founder of CartoVista. “This release represents a significant leap forward in data presentation and analysis capabilities. We are committed to empowering our users with powerful tools and features that will enhance their data storytelling and decision-making processes.”
Experience the future of geospatial data visualization with CartoVista Cloud 8.5. Join us at the GeoMTL conference and be among the first to explore this remarkable release.
Start creating your first
Story Map for free
today!