

Crafting a compelling story with geospatial data
Storytelling is a powerful tool that can help to convey complex ideas and inspire action. When it comes to crafting a good story with geospatial data, there are four essential elements to consider:
Context
Defining your audience and what they need to know is critical. Understanding your audience’s context will help you tailor your message to their specific needs and ensure that the information presented is relevant to them.
Interaction
Enabling your audience to discover and explore your data with interactions such as datatips and charts. By allowing your audience to interact with the data, you give them a chance to discover the key takeaways, making the information more meaningful to them.
Efficiency
Ensuring that your information is easily digestible and not overwhelming will help your audience better understand your message. This means choosing the right amount of information to display, avoiding cognitive overload, and organizing the information in small chunks to key to avoid clutter.
Design
Great Visual Design helps your audience understand your message more easily by guiding them through your story in a clear and concise manner. This involves adding cues to direct your audience’s attention in the order needed.
Together, these elements help to ensure that your audience can quickly understand your message without being overwhelmed.
How Story Maps are being used by municipalities
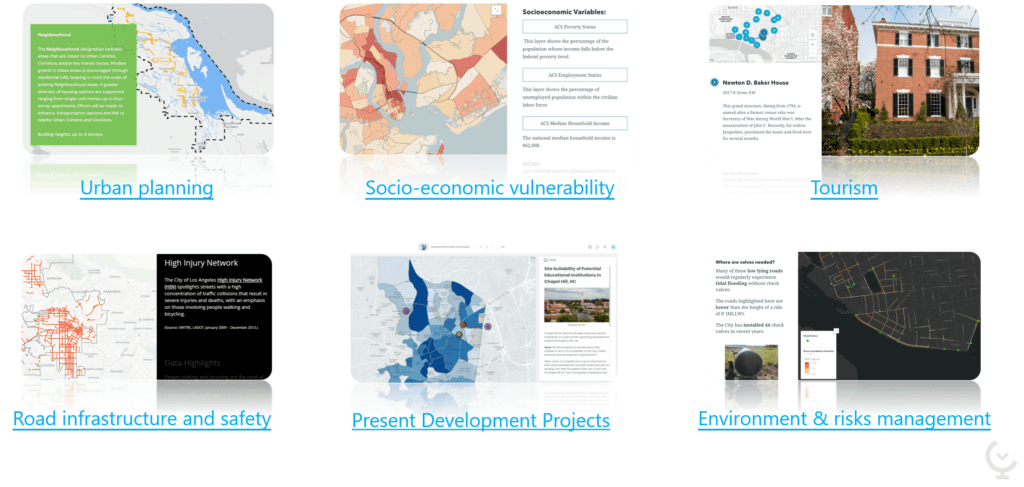
Story Maps are used in a wide variety of areas in local government, from urban planning and growth, environmental sustainability, to transportation infrastructure and more. They help to simplify technical documents into readable and interactive experiences, making them a powerful communication tool.
In municipalities, GIS departments are typically responsible for managing city data, which involves dealing with a large number of internal and external datasets. Story Maps can help to improve communication with both internal and external users, including city councillors, elected officials, and citizens. They provide transparency and easy access to information, making them a valuable tool for local government.
Story Maps are often used in urban planning to inform citizens of new urban development projects, and/or get feedback from the population. A great example is the City of Nanaimo’s Story Map of their city plan. It introduces the city’s expansion plans for 40,000 new citizens over the next 25 years. Their Story Map is used to simplify a very long technical document into a readable and interactive experience.
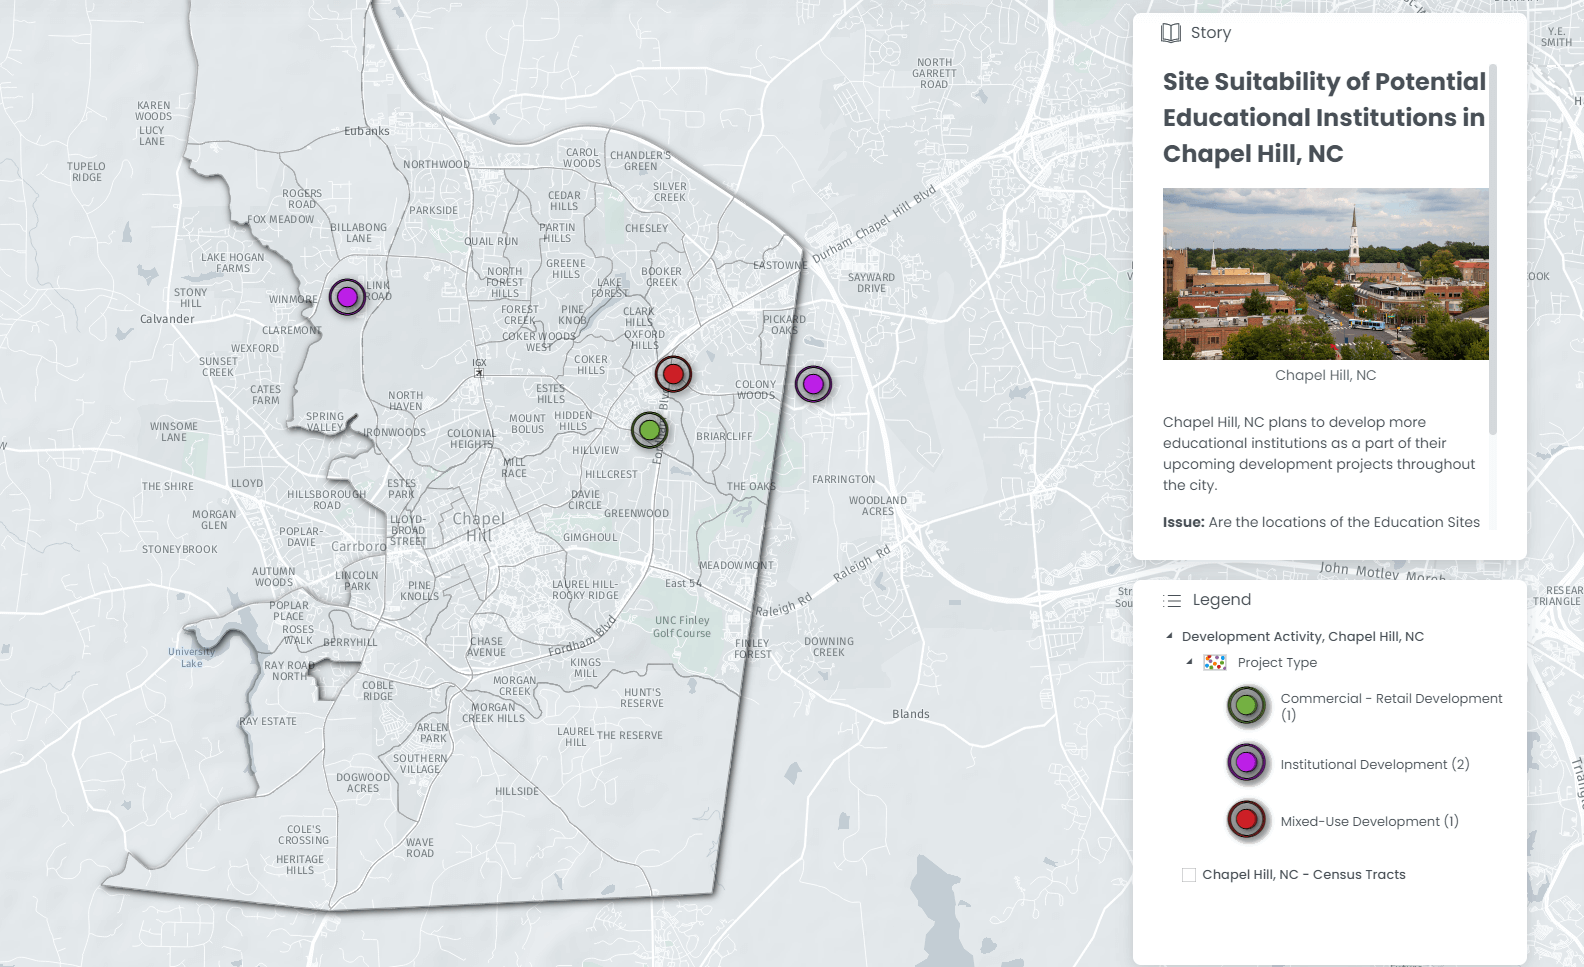
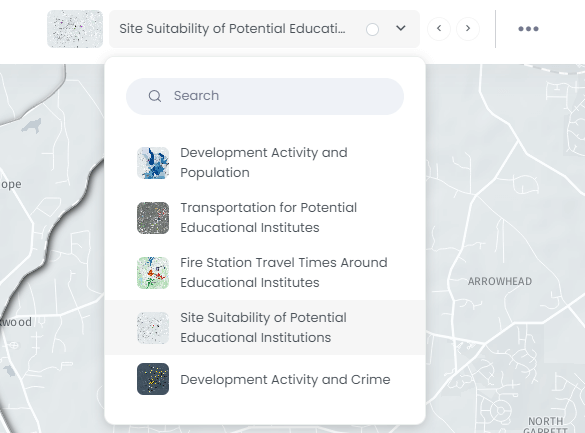
Story Maps are also used to present urban development projects. We created an urban development Story Map, using CartoVista, for the city of Chapel Hill. This Story Map explores the suitability of four potential sites for educational infrastructures. The story Map is divided into four slides that cover the different criteria: surrounding population, buses and transportation routes, drivetime of fire stations, and finally crime data to make sure the school is in a safe zone. In each slide, the Story panel provides text and images to explain the criteria and the suitability of each site.
Cities also use Story Maps to inform public stakeholders about the social and economic profile and vulnerabilities of the community. This Story Map from the city of Charleston breaks down several social and economic indicators, providing context and explanation of these indicators. It also explains how this data can be used to make decisions and take action.
![]()
Check out other ways Story Maps are used to showcase municipal business activities or projects
Goals of story mapping
Story Maps can have three different goals or purposes:

Tip #1: Raising awareness
Introduce strategic priorities to community stakeholders and provide context and explanation in an easily digestible manner.

Tip #2: Persuading an audience
Convince stakeholders of the importance of a topic by providing arguments supported by data

Tip #3: Inspiring action
Provide guidance on the actions to take and show the impact of these actions.
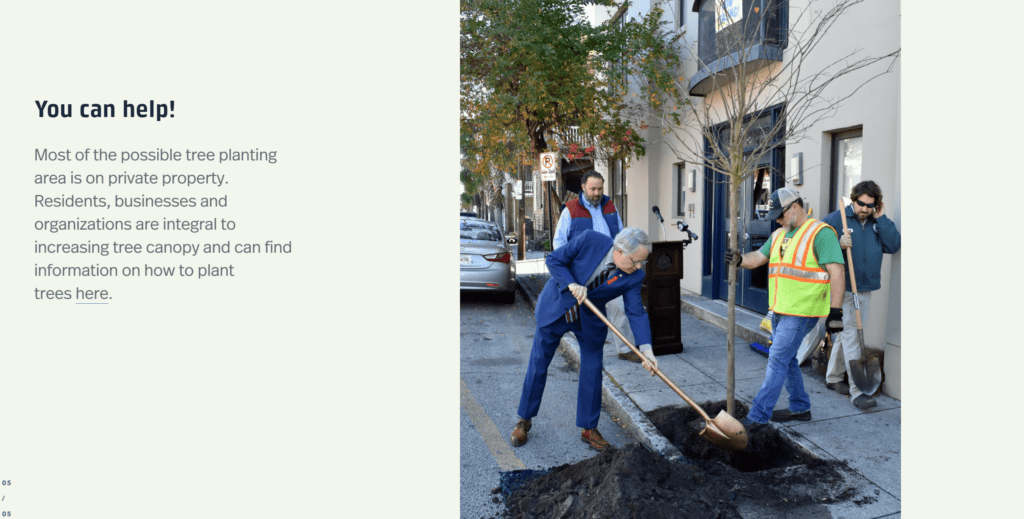
For example, the City of Charleston designed their Story Map to raise awareness about street tree canopy coverage. They start by introducing the topic with data used to show that there is unequal tree canopy coverage across different neighborhoods.
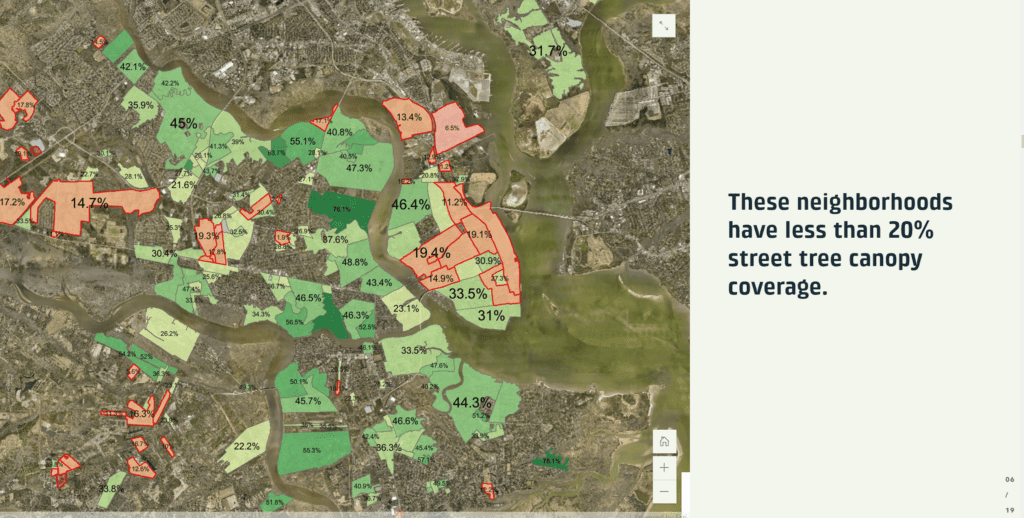
Next, they explain that neighborhoods with less coverage are hotter than those with greater tree coverage , and that this is also related to inequity among the citizens.
Previous slide
Next slide
To persuade their stakeholders, they used their story map by showing opportunities with areas where more trees could be planted on public and private properties.
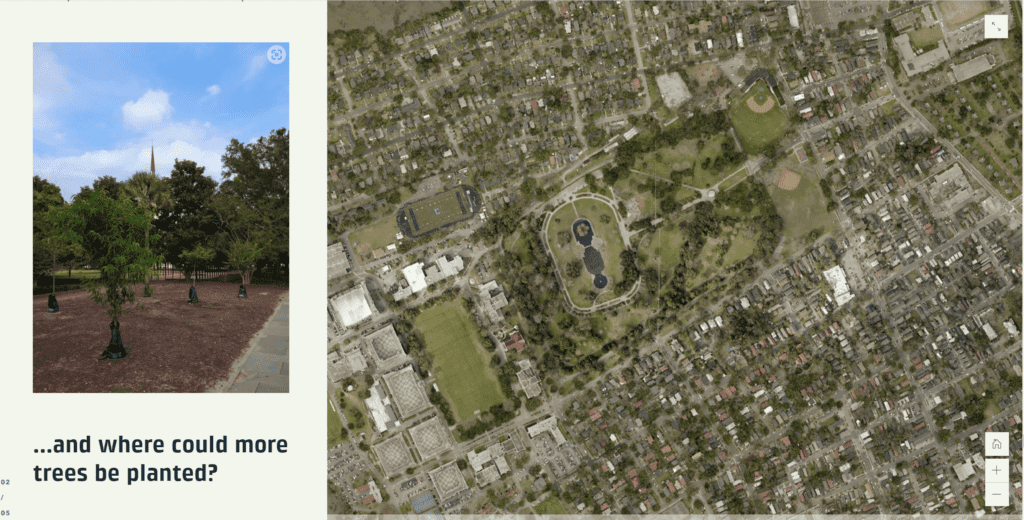
To inspire action, the authors of the map then invite the owners to help the city and plant trees.
Why Story Map presentations are more powerful than regular maps
Story Maps are more powerful than regular maps in that they allow for a step-by-step process, leave room for explanation, and captivate the target audience.

Step by step process

Leave room for explanation

Captivate target audiences
Step by step process
Great Story Maps create a step by step process flow where the information and the data is gradually shown to the user. This also helps create a narrative that combines the argument and the data into a compelling story. This results in making the information easier to understand.
Let’s look at the Urban Planning map by the city of Nanaimo to illustrate this. This Story Maps introduces each layer one at a time, with explanations on each layer so that the map is created step by step before the eyes of the end-user.
Leave room for explanation
Story Maps also provide more room for explanation in terms of allowing the creator to add text to the map to provide more context and meaning. The text can be used to explain the map structure, this is what the Urban Planning Story map of Nanaimo does. Text can also provide contextual information, or simplify technical questions.
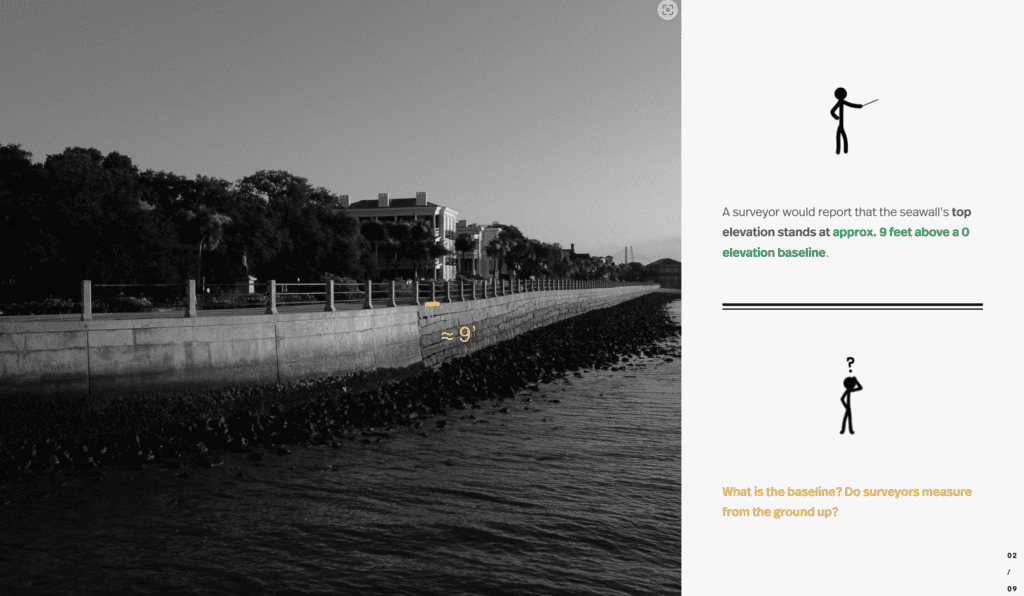
Another good example is the Story Map of Charleston tide measurements. This map goes into quite technical details, explaining how land elevation is measured, elevation reference systems and tide measurements systems. They use questions, images and a step-by-step explanation to simplify and educate the end-user.
Captivate target audiences
Lastly, Story Maps are also better at captivating the target audience, through several means:

Use of visuals
The integration of images helps focus the target audience

Answer questions
Answers to stakeholders questions are integrated in to the Story map

Map Interactions
A Story Map allows the audience to interact with the map directly, keeping them involved and engaged.
Overall, these 3 aspects of Story Maps make it easier for the user to understand, remember and feel involved in the discussion presented by the Story Map.
Creating your own GIS Story Map presentation
Here are 6 tips to create your own GIS Story Map Presentation:
Tip #1: Identify your audiences
When designing story maps for the local government, it is important to keep your audience’s interests and backgrounds in mind. The story map should focus on addressing the goal without noise. Less is more and simplicity will make it easier for the end user to understand the story map. This was addressed in the Chapel Hill Story Map example where we start by introducing the topic with just the necessary layers of information for our audience.
Tip #2: Choose your platform
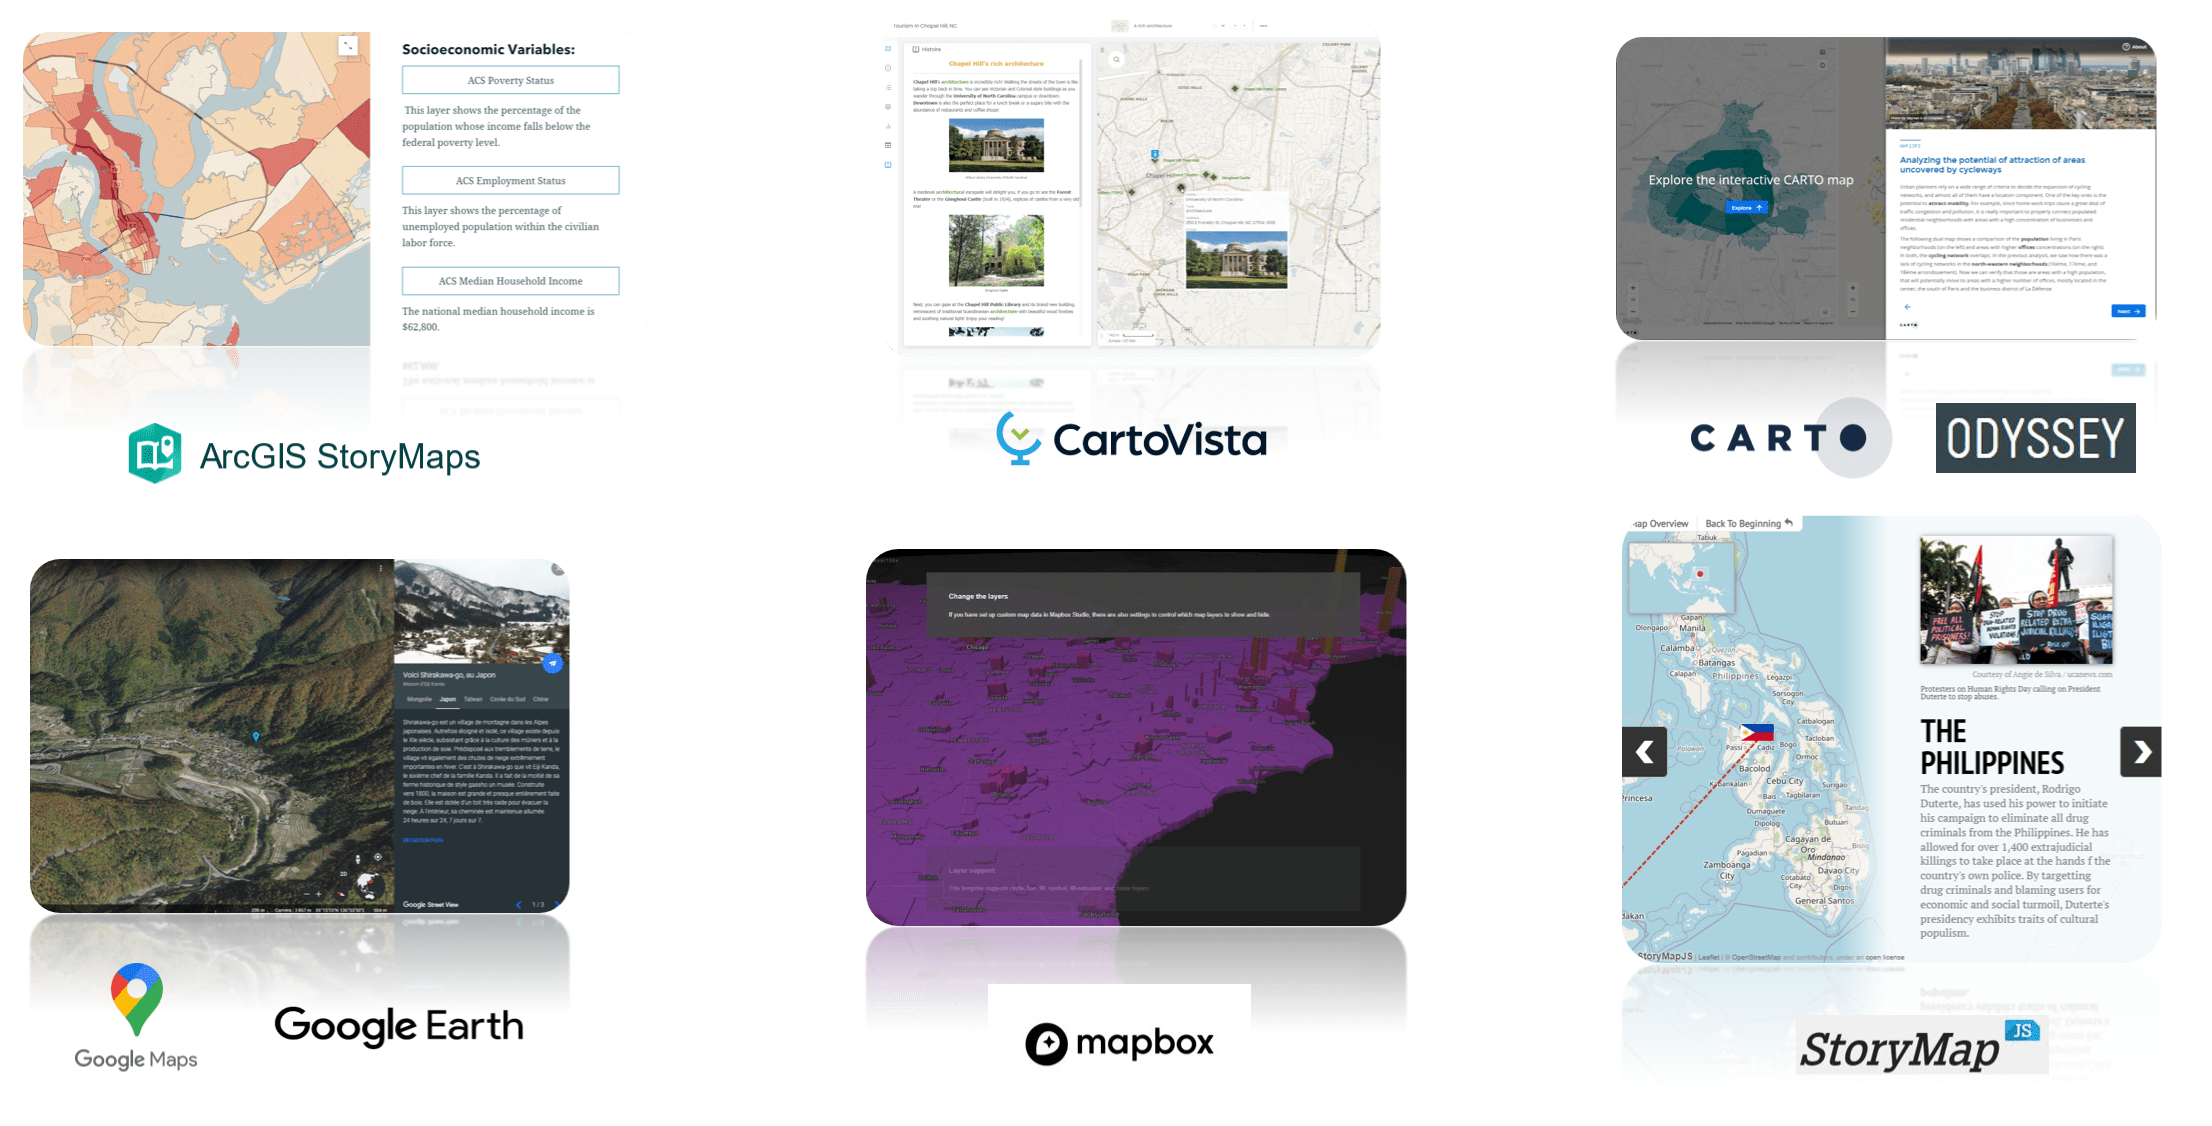
There are several platforms available for creating Story Maps, including CartoVista, ArcGIS Online, Carto and Mapbox. Choose the platform that best fits your needs and skills. For obvious reasons, we’re keen on CartoVista for its ease of use for technical and non-technical GIS users.
Tip #3: Gather and organize your data
Choose the data that best supports your story, and break it up into small, digestible chunks.
Tip #4: Design your Story Map
Use the essential elements of a good story and great visual design to create a compelling story that captivates your audience. This can be done by incorporating supporting multimedia to the Story Maps, adding custom layouts and styling the data to leave viewers engaged and interested. In our Story Map for Tourism purposes, we integrated images to engage the user and allow them to get a sense of what to do and see in the city.
Tip #5: Enable your audience to interact with the data
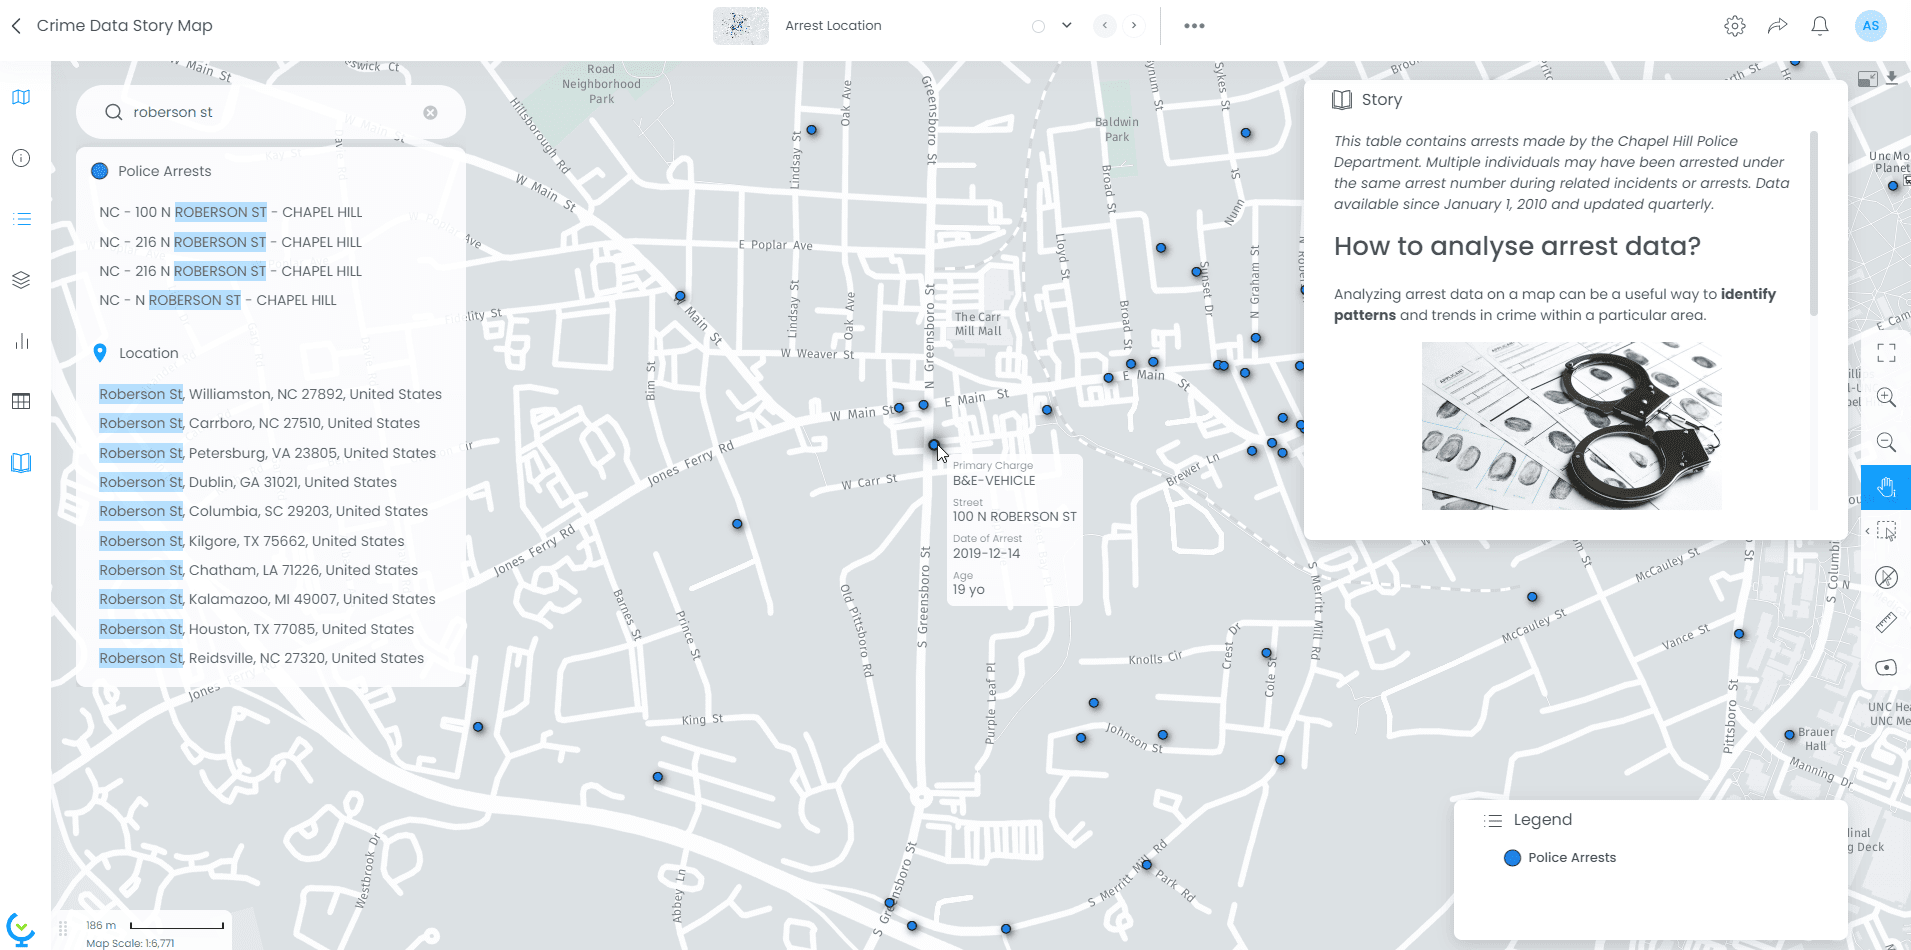
To make your Story Map presentation effective, it is helpful to set up meaningful data tips and highlight data with the help of filters. Allow the user to search data with the appropriate fields, so they can explore on their own too. We also built a Story Map dedicated to Arrest data to help the city understand how they can use this data to understand the distribution of arrests made in the town. In this Story Map, we ensure to set up proper search fields so that the user can navigate in the map and zoom in to any arrest location easily.
Tip #6: Test and refine
Test your Story Map with your target audience and refine it based on their feedback.

Conclusion
In conclusion, GIS Story Map Presentations are a powerful tool that municipalities can use to communicate with both internal stakeholders, the local community, and the general public. By following the four essential elements of crafting a good Story Map and the step-by-step process of creating your own GIS Story Map Presentation, you can create a compelling visual story with geospatial data. Remember to keep it simple, clear, and organized, and use interactions and visual cues to guide your audience through your story.