


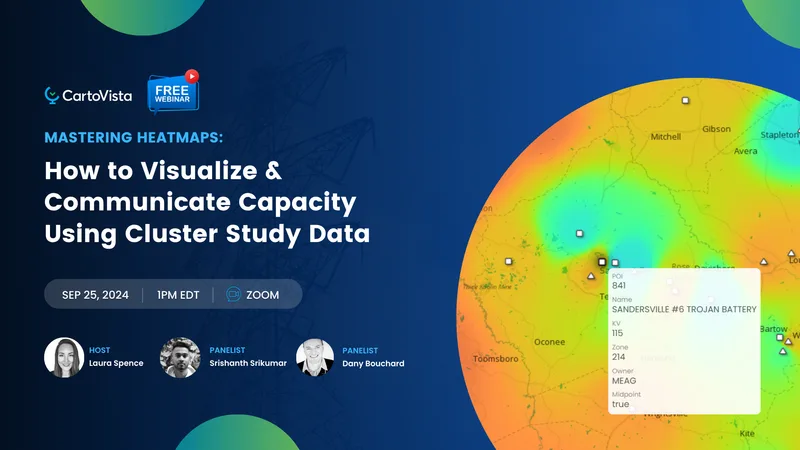
After years of working with leading utility companies, we have gathered practical tips and best practices for building interactive heatmaps that meet FERC compliance standards.

What you will learn
- Types of heatmaps for visualizing capacity
- Visualizing the impact of MW injection
- Overlaying current queue activity
- Managing large datasets in transfer analysis studies
- Speed and responsiveness in capacity maps
- Design and user experience best practices
- Automating data updates with APIs
Speakers
-

Laura Spence
Host
-

Dany Bouchard
Panelist
-

Srishanth Srikumar
Panelist
Watch on demand
We will email you a link to this recording so you can watch it again whenever you need it.