


Identify risks: Insurance
Overlay hazard, exposure, and portfolio data on interactive maps
Help underwriters and actuaries assess catastrophe risk and communicate findings clearly. CartoVista helps insurance teams evaluate exposure and share risk insights without heavy GIS work.
Trusted by leading insurance organizations
Client logos: Promutuel Assurance, Intact Insurance, CATALYST (a PCI Geomatics brand), Assistel









CartoVista helps your insurance team to
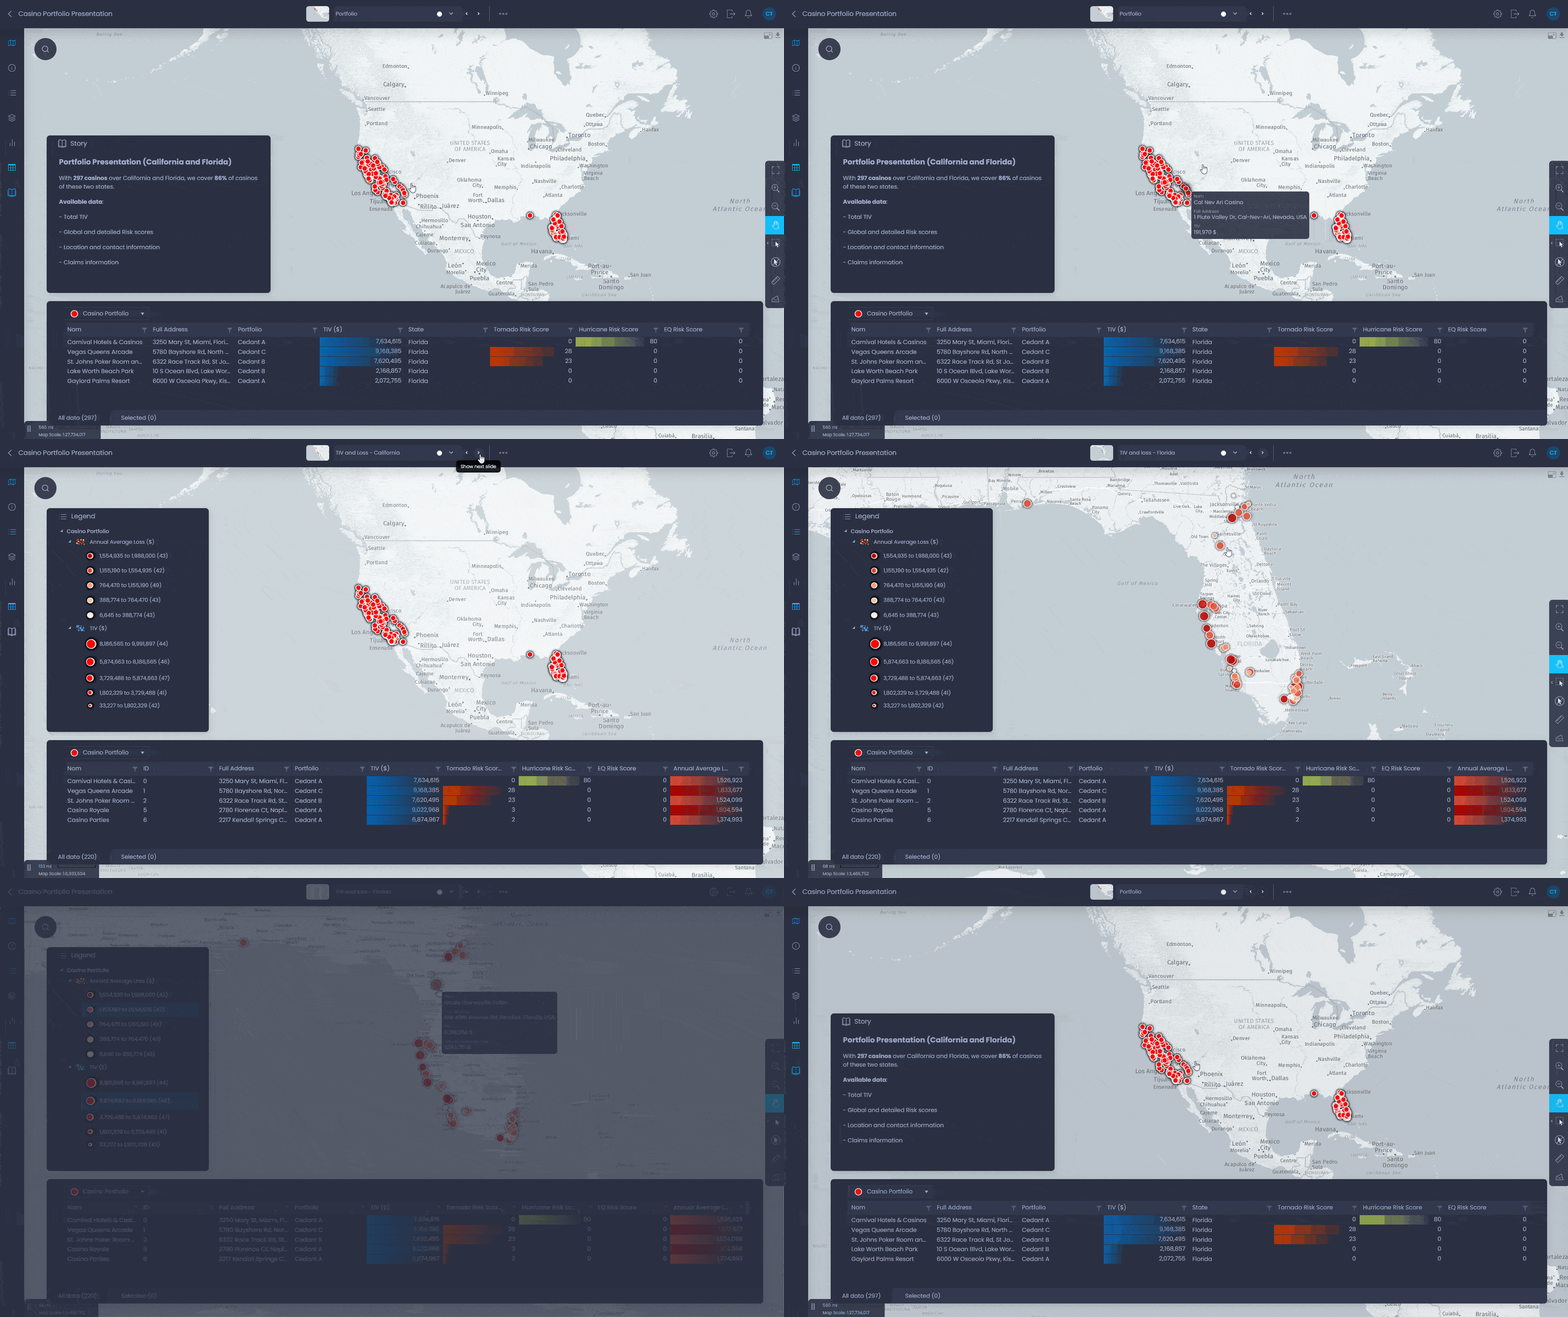
- Share portfolio and exposure data on interactive maps
- Overlay hazard data for catastrophe planning and response
- Strengthen underwriting with integrated risk and modeling layers
- Communicate risk visually to support better business decisions

More than 75% of the financial services and insurance industry rate location intelligence as either very important or critical to their success”
Dresner Advisory Services 2018 Location Intelligence Markets Study
What you can do in CartoVista map interface
- Add your own location data via drag & drop
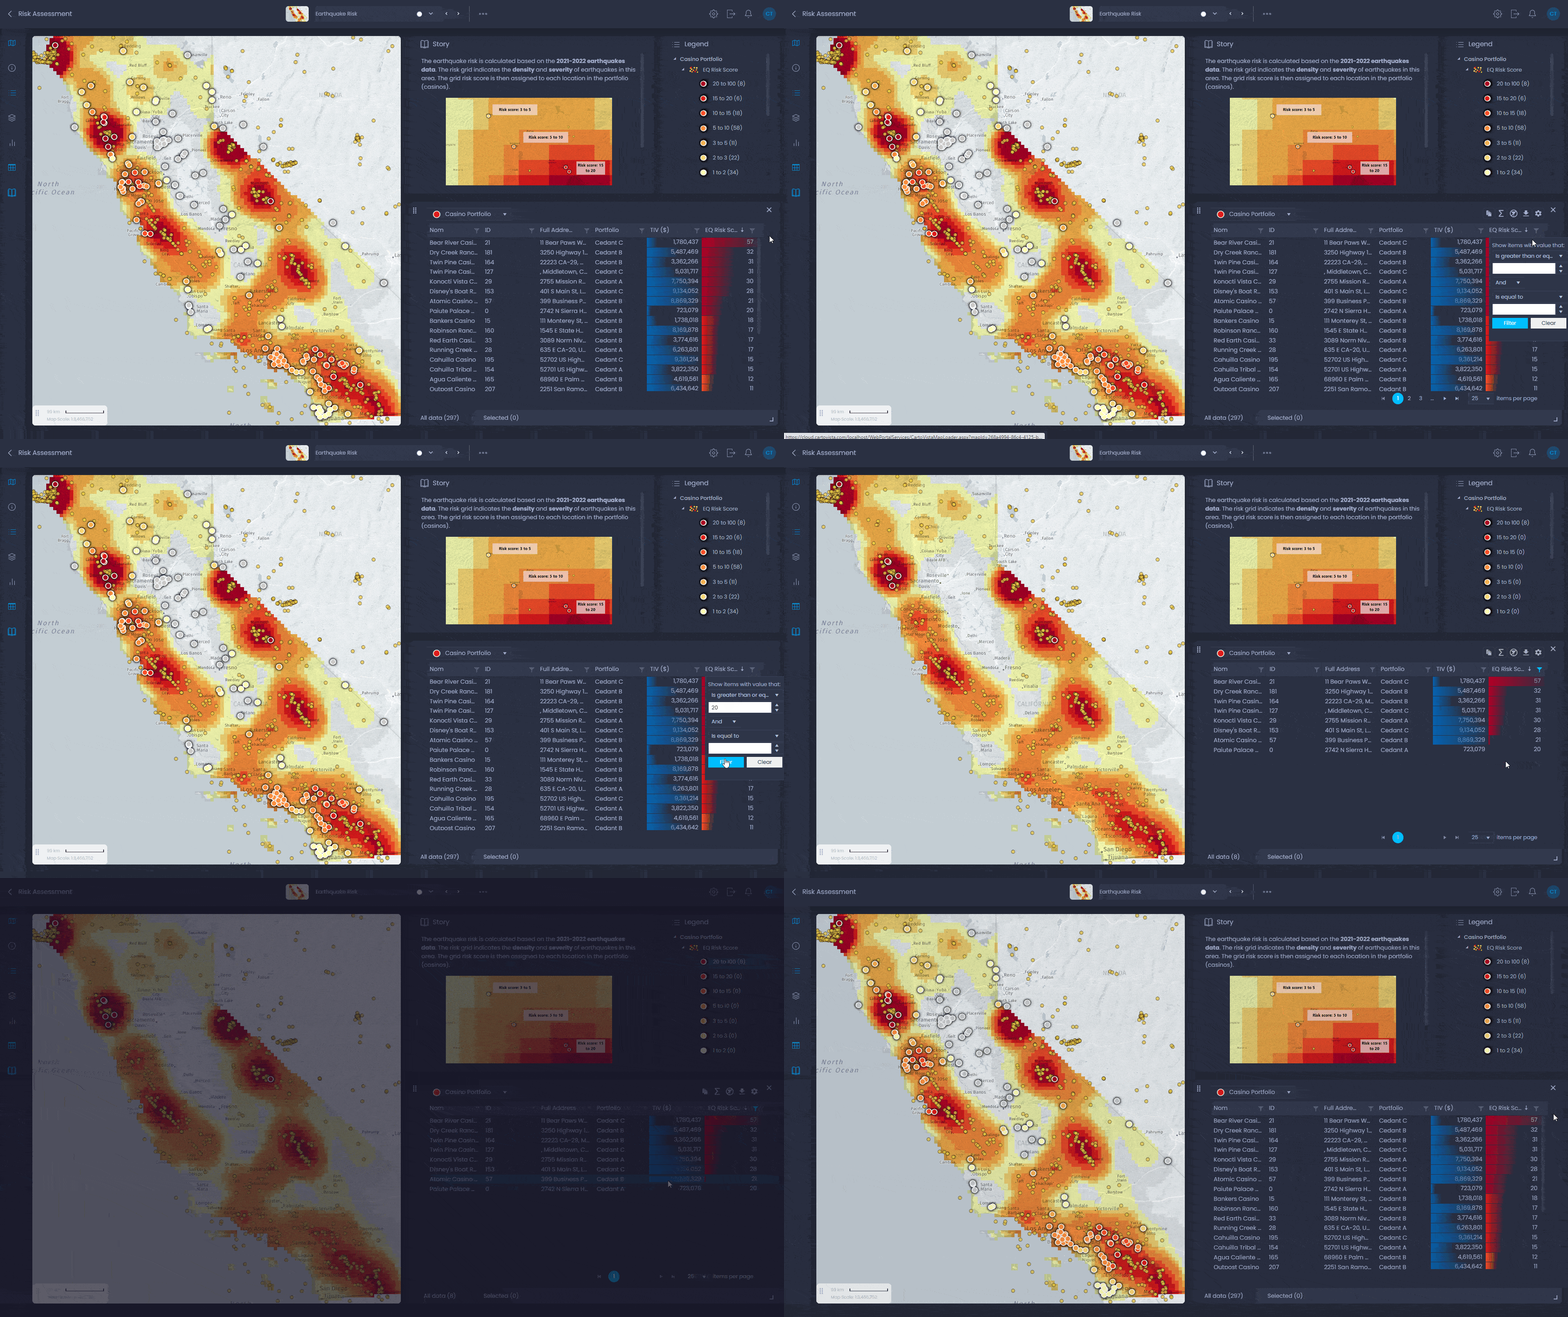
- Add risk/modeling data (USGS, HU tracks, FEMA flood maps, RMS, AIR, Verisk)
- Configure how the data is displayed with just a few clicks
- Share with your team to answer business questions visually
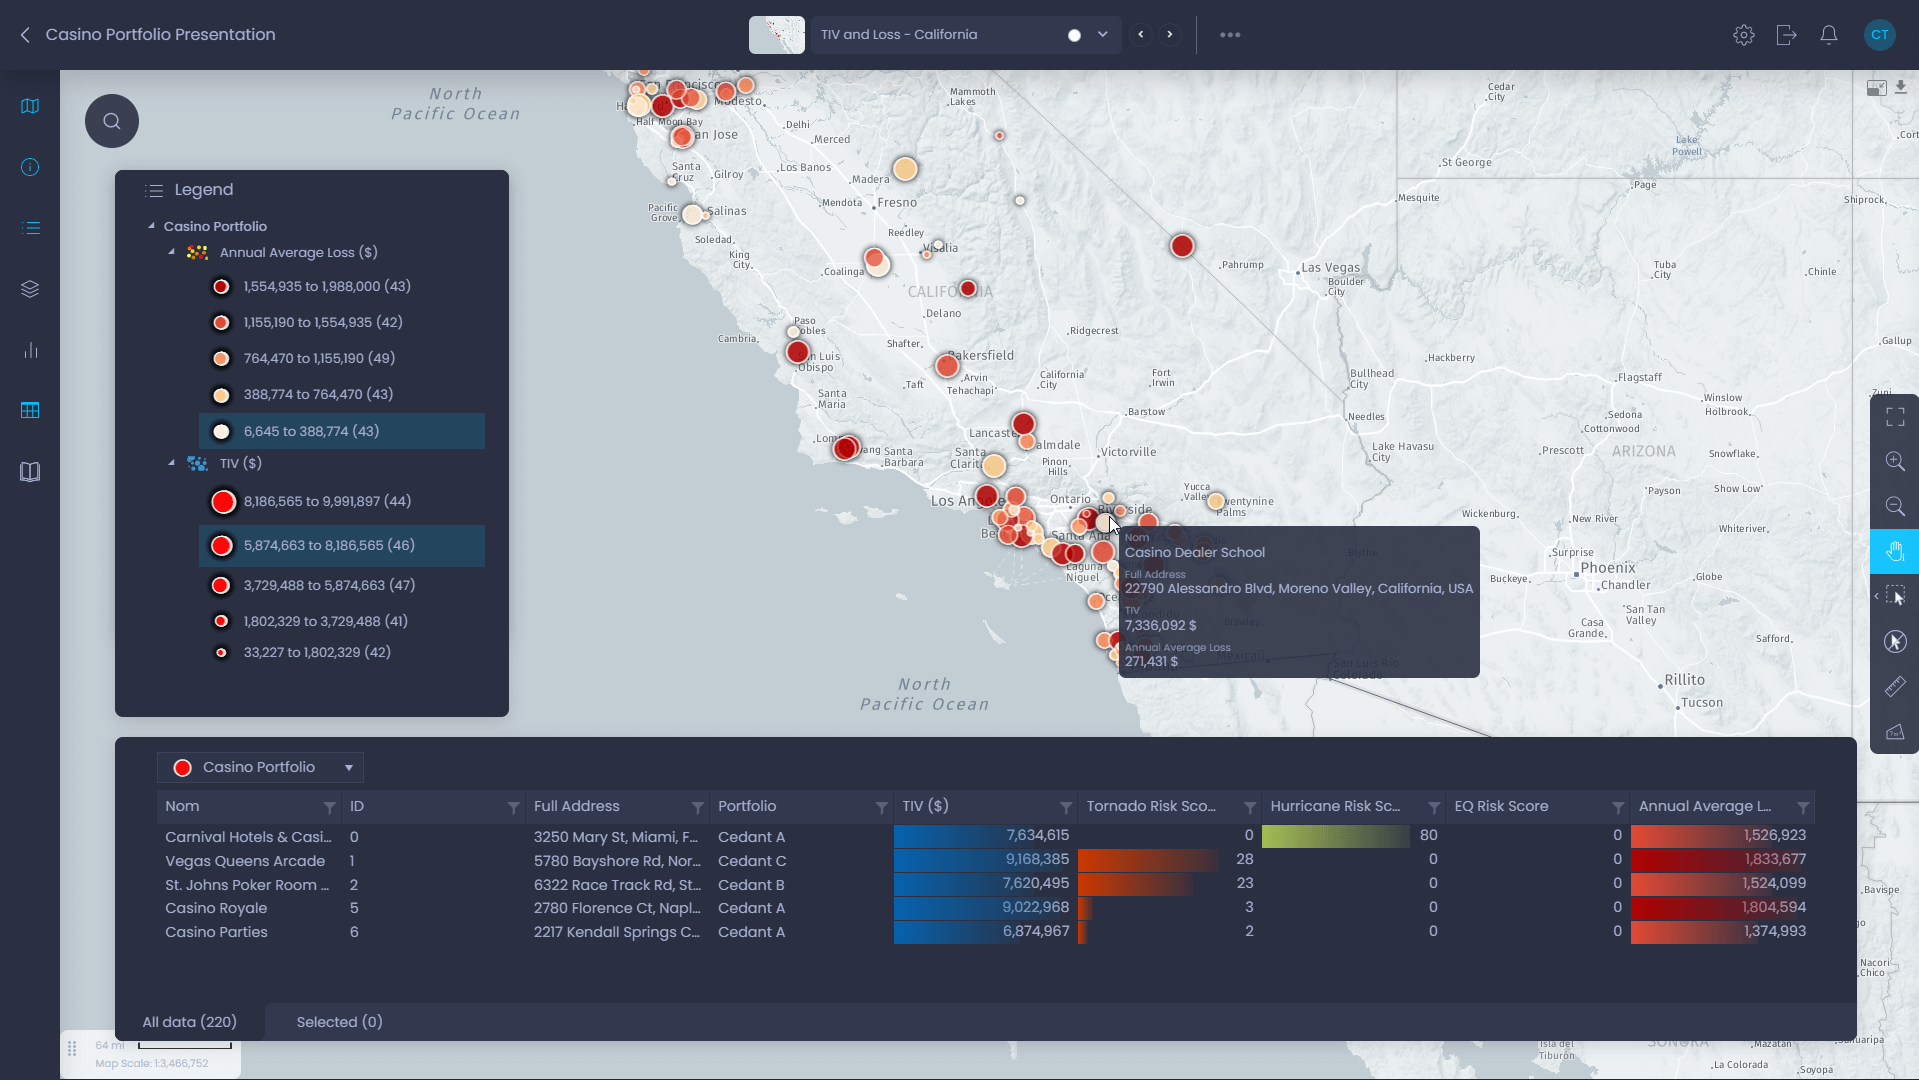
CartoVista in action for insurance
Browse use cases
- Underwriters
- Data scientists
- Data analysts
- Business analysts
- Actuaries
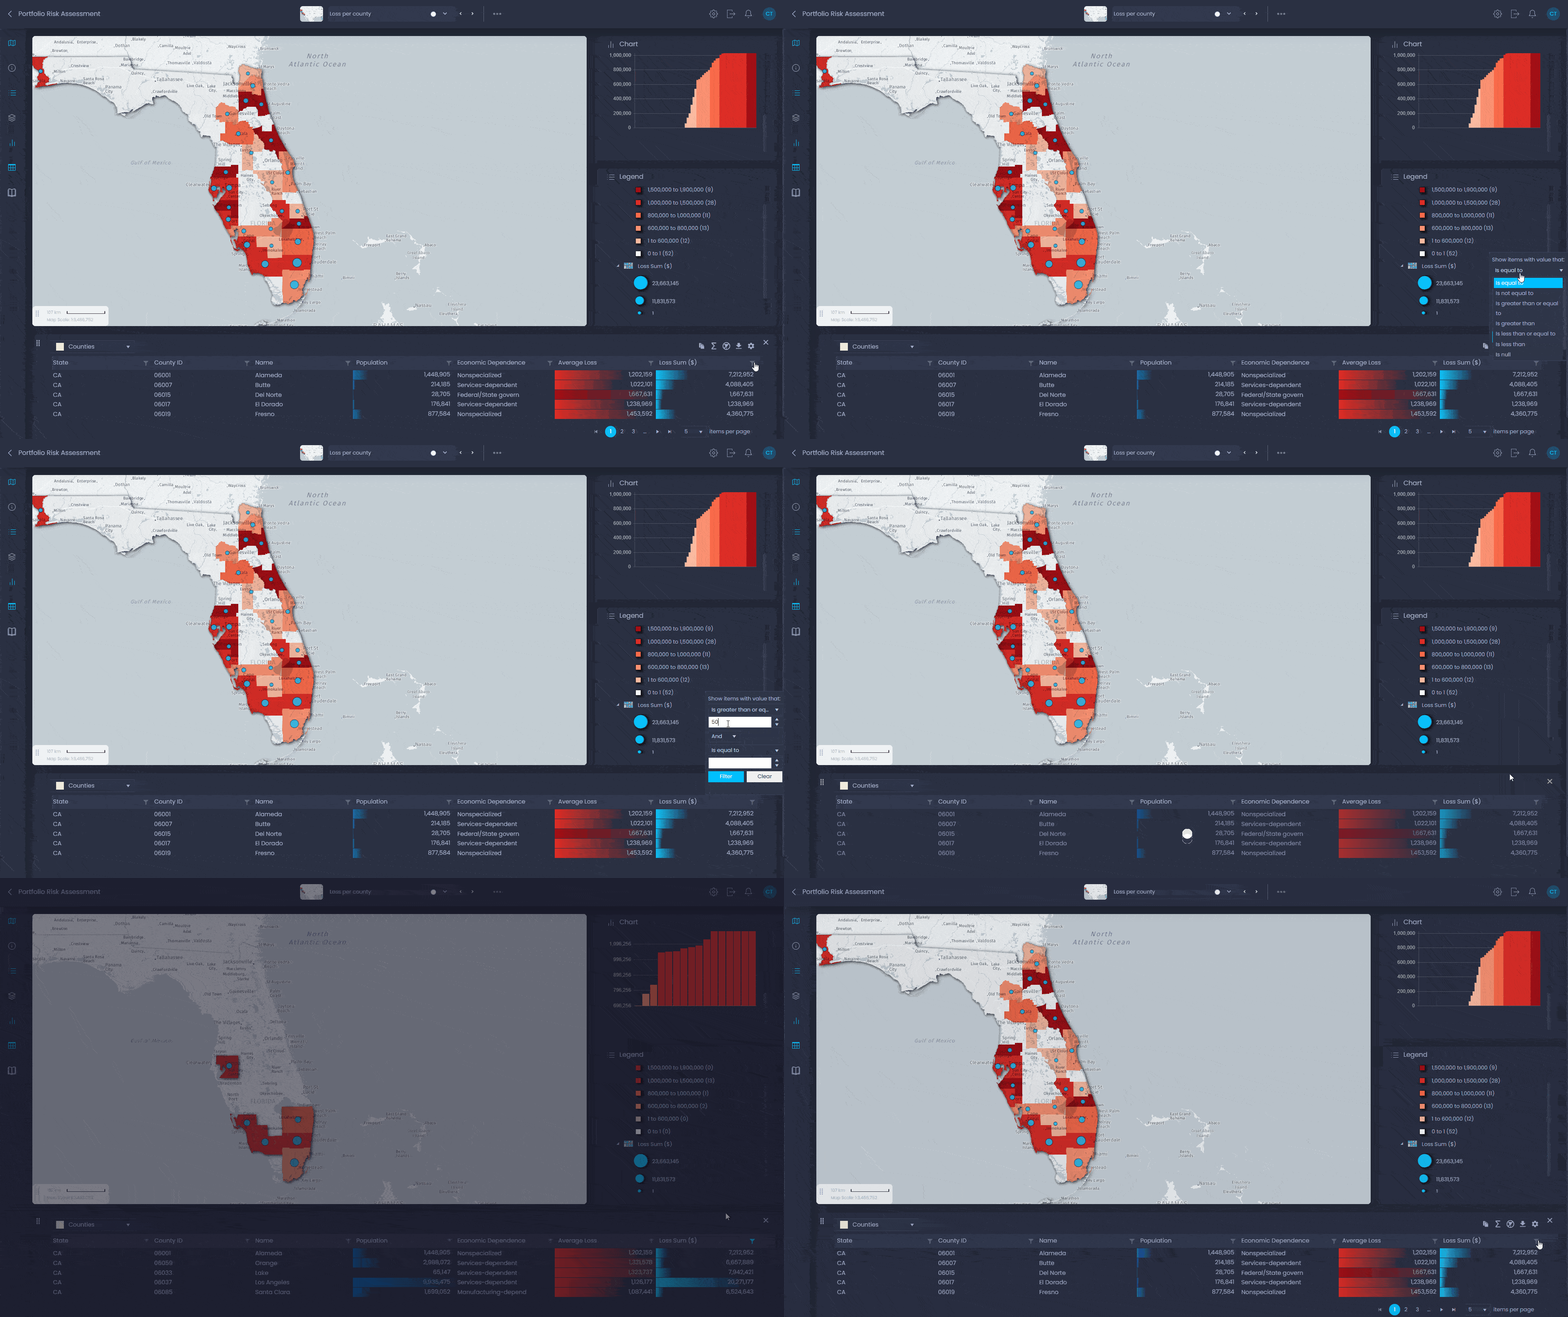
Catastrophe Risk Analysis
Integrate your own portfolio and risk/modeling data related to natural disasters (earthquakes, flooding, hurricanes, tornadoes, wildfire), for example: USGS, HU tracks, FEMA flood maps, RMS, AIR, Verisk.