

Environmental analysis: Environment
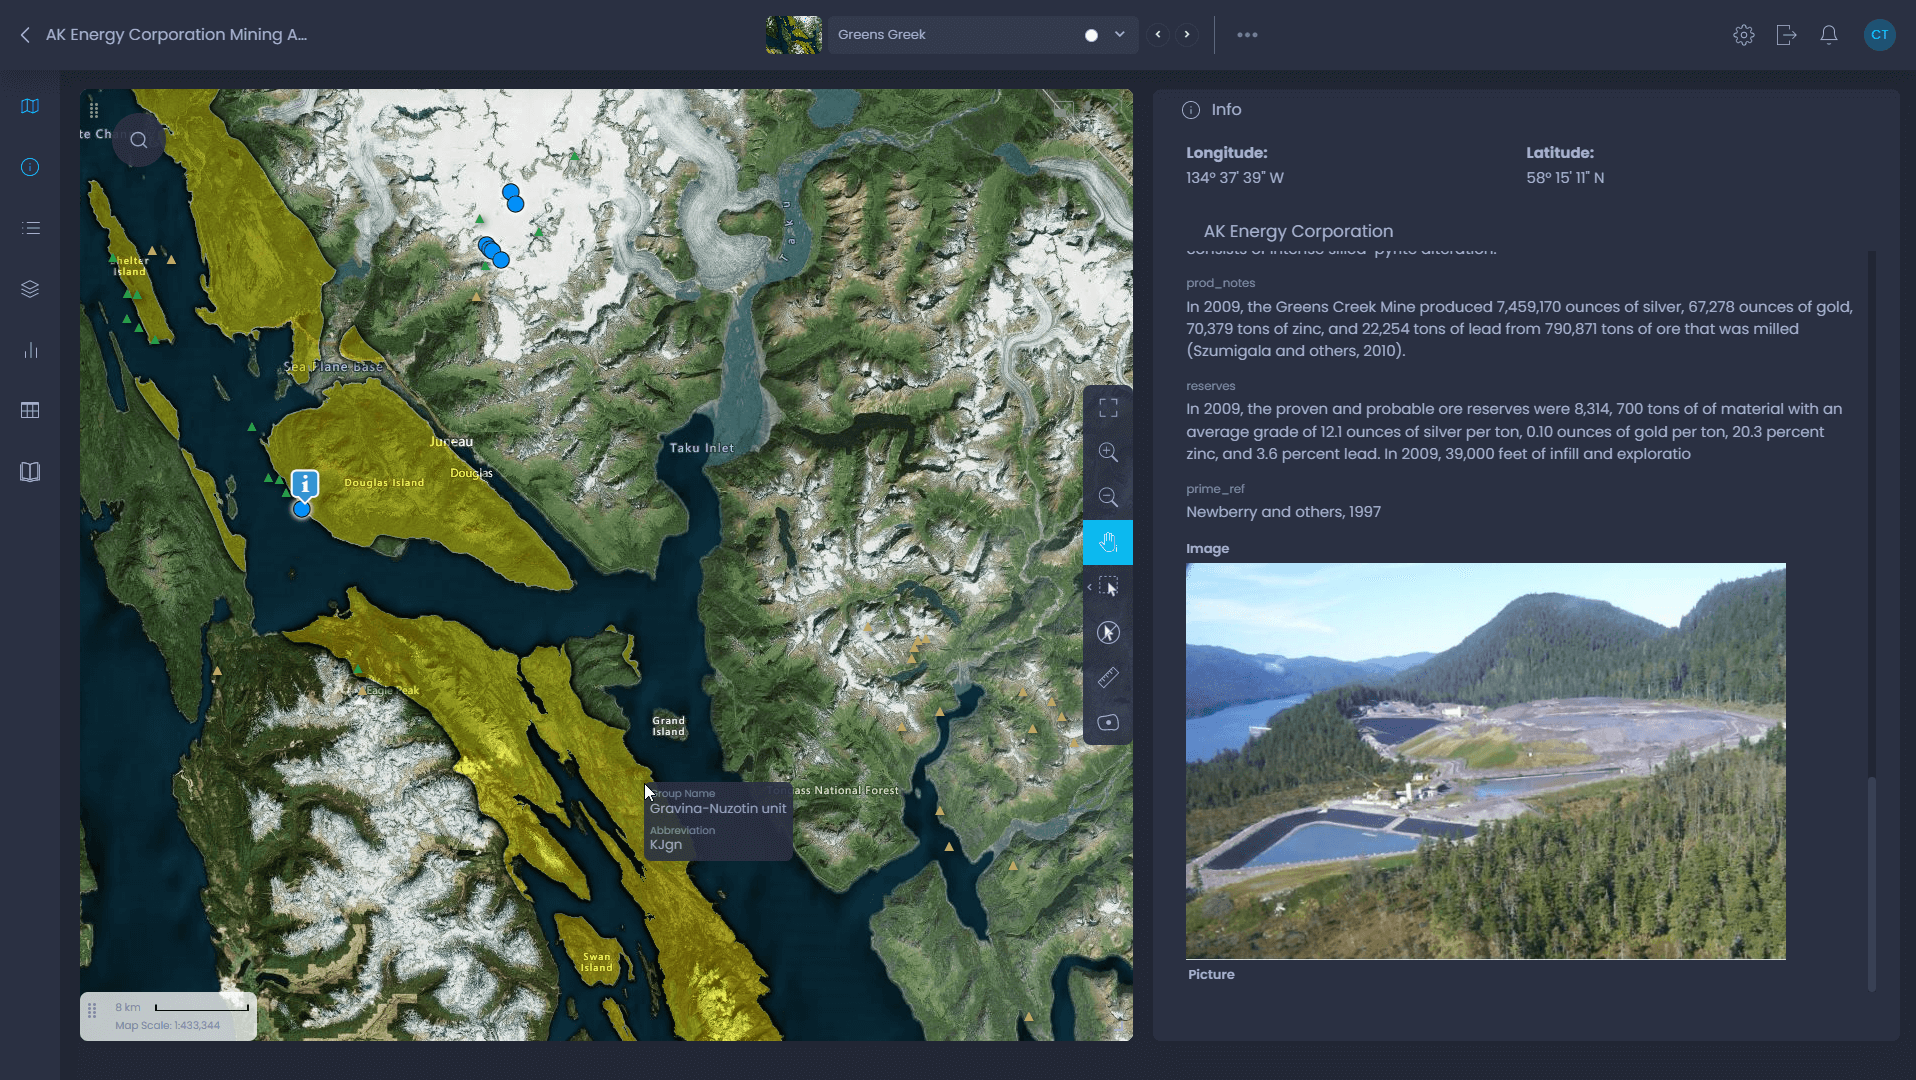
Map habitats, monitoring sites, and environmental indicators on interactive maps
Support conservation, compliance, and public engagement with clear geospatial stories. CartoVista helps environmental teams monitor change and share findings without heavy GIS work.
Trusted by environmental research and consulting organizations
Client logos: BluMetric Environmental, Université du Québec à Rimouski (UQAR), CATALYST (a PCI Geomatics brand), TB maestro










CartoVista helps your environmental team to
- Monitor environmental change on interactive maps
- Assess environmental risk with integrated geospatial data
- Support conservation planning and biodiversity programs
- Share data and insights for compliance and public engagement

Continuing advances in GIS technology have established mapping as a crucial means of identifying connections between the state of the climate and other areas of concern.
University of Southern California GIS Blog
What you can do in CartoVista map interface
- Add your own environmental data via drag & drop
- Configure how the data is displayed with just a few clicks
- Create meaningful views that tell a story
- Add other geoscience layers of interest