


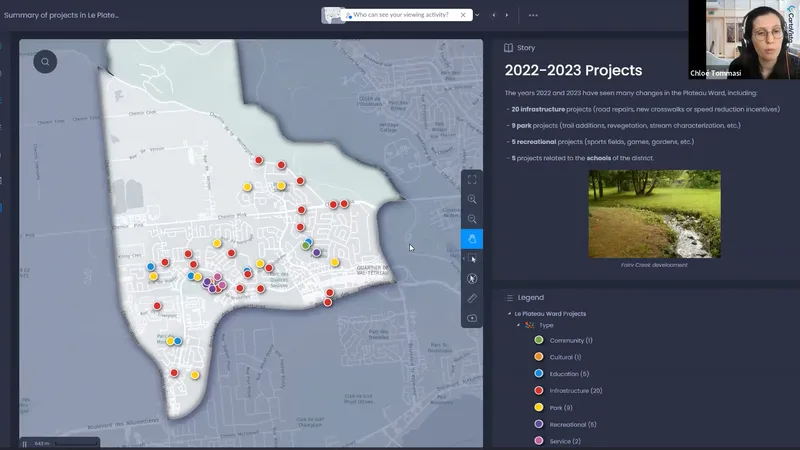
One of the most valuable assets that every city owns is its data. Translating that data into insights and opportunities to help forecast, respond, and plan can be daunting and complex – especially if you are not a GIS or data visualization expert. Learn how to quickly and easily create meaningful, persuasive presentations, on your own, leveraging your municipal data.

What you will learn
- What interactive story maps are, and how they are used to visually present municipal data
- Real life examples of story maps that have been used by elected officials in decision-making
- Best practices on how to add your own spreadsheet data
- How to create a map and presentation that clearly communicates your story and answers stakeholder questions
Speakers
-

Dany Bouchard
Host
-

Chloé Tommasi
Panelist
Watch on demand
We will email you a link to this recording so you can watch it again whenever you need it.