




Grid layers and time series…
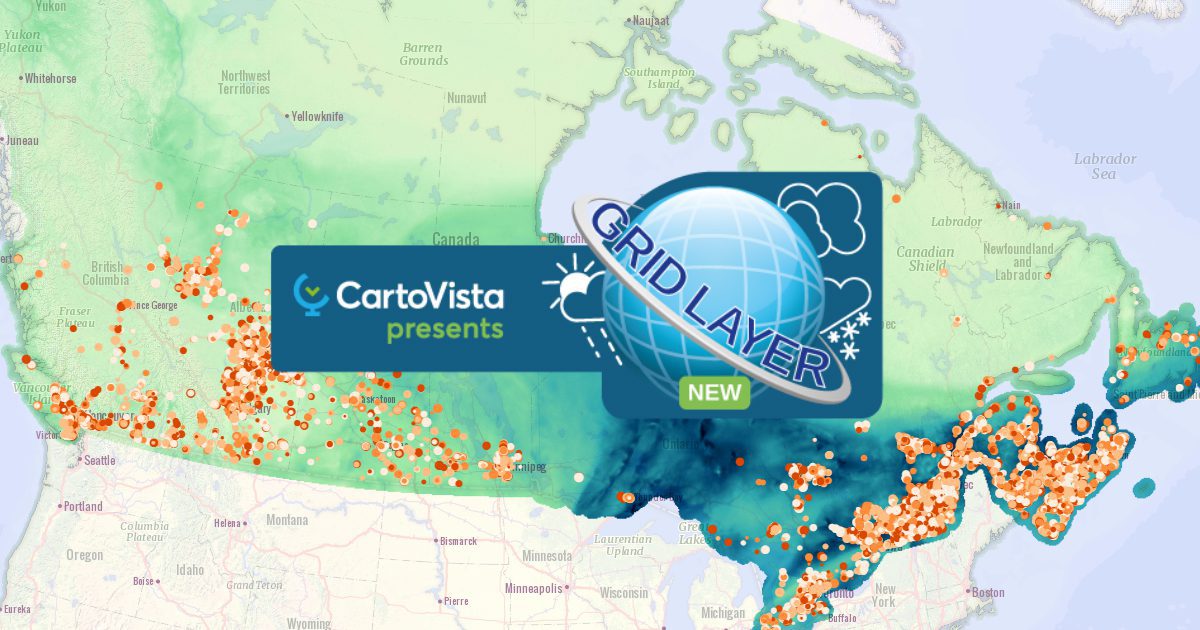
Our example uses actual precipitation data, but you could also use other relevant information such as rising water, desertification, drought, elevation, vegetation indices and much more! This tool also allows you to display your data in a time series, which will allow you to follow the evolution of your data over time and track, for example, major weather events.
…Combined with vector data
To show you how you could combine our grid layers with vector data, we’ve included fictitious claims information to demonstrate how you could link the data to provide very useful maps. By using a raster layer, officials and insurers can better understand the impact of changing weather conditions on risk and property losses.
If you are looking to combine raster and vector layers in a more practical and useful way, please contact a member of the CartoVista team to learn more!