



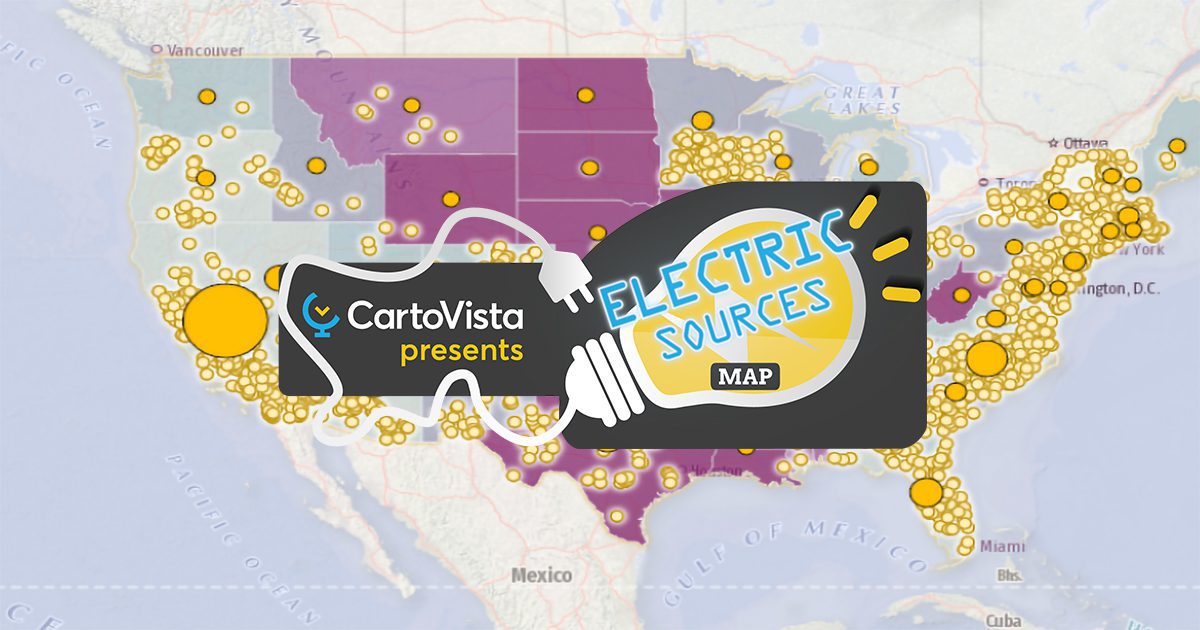

Power Plants and Total Electricity Production by State
CartoVista has identified and mapped all the power plants in the country, classifying them according to the energy source used (nuclear, solar, hydro, etc.). Electricity production by states is also represented by an orange gradient (in MW).
Electricity Sources by State
This theme shows the type of electricity generation through a pie chart for each state. It helps to see local energy policies clearly and promptly. A purple gradient also notes the electricity consumption per capita for each state (in 2020 and million BTUs).
Electricity Sources
Finally, these themes represent the type of source of electricity generation in the United States by focusing on:
- Coal-fired power plants,
- Oil-fired power plants,
- Nuclear power plants,
- Natural gas-fired power plants,
- Wind power plants,
- Hydraulic power plants,
- Solar power plants.