




In today’s fast-paced world, data visualization tools like CartoVista are a game-changer for showcasing complex datasets in an engaging and easy-to-understand format. Using CartoVista’s intuitive platform, we were able to effortlessly import, update, and visualize the data behind the 2025 Canadian Federal Election. By following a few simple steps, we were able to generate the interactive election map you can explore below.
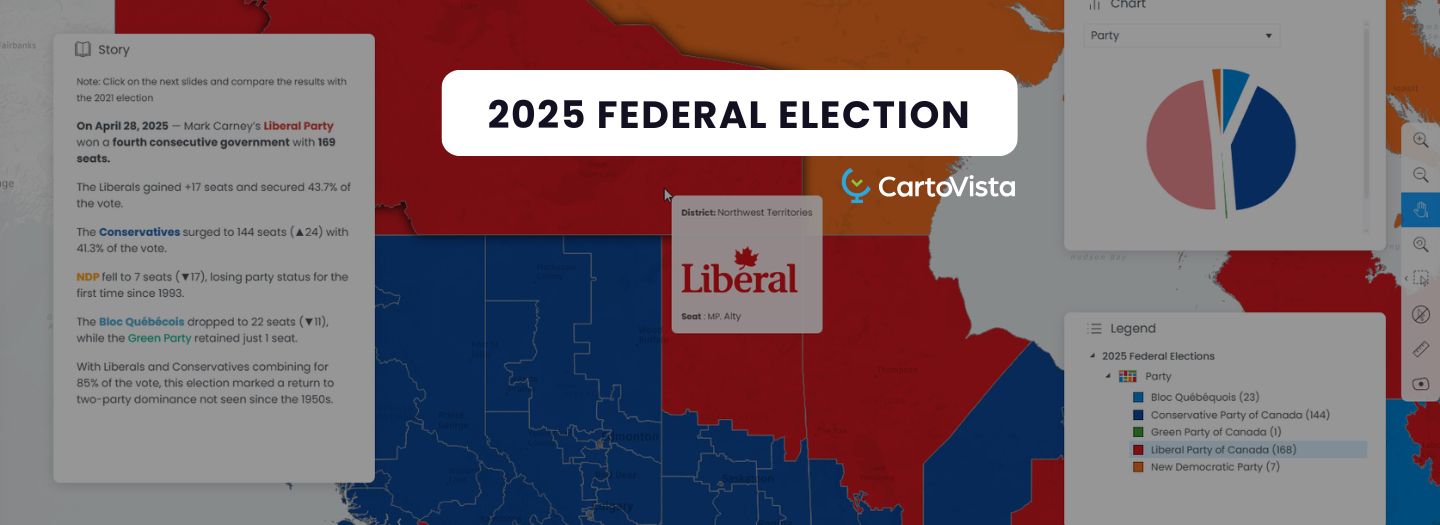
Import and update your data easily, create and share your own stories 2 clicks away