Mousing
Interactive Map Features
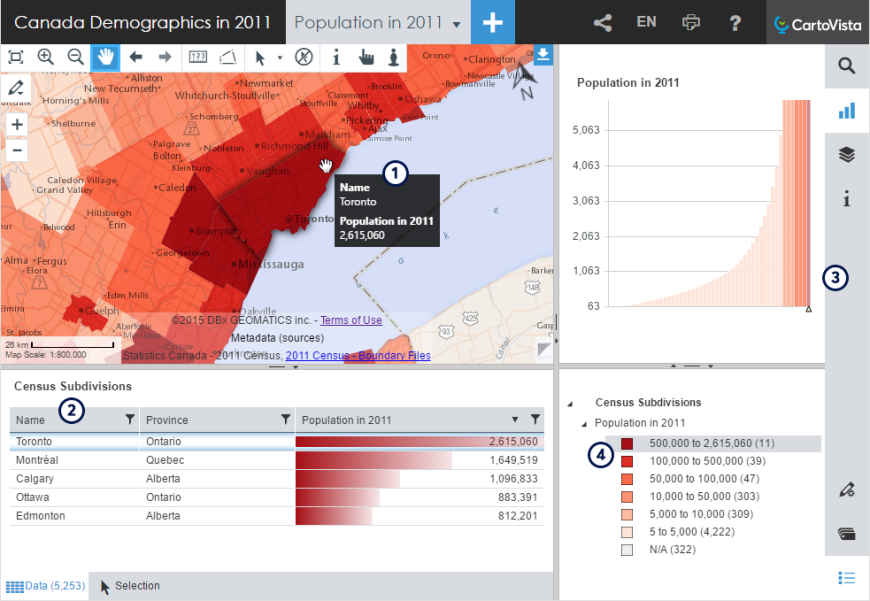
In order to help users understand the data, CartoVista includes advanced functionality available when mousing the mouse over interactive map features.
- The map layer's data tip can include any thematic data.
- The corresponding row is highlighted in the Data and Selection panels.
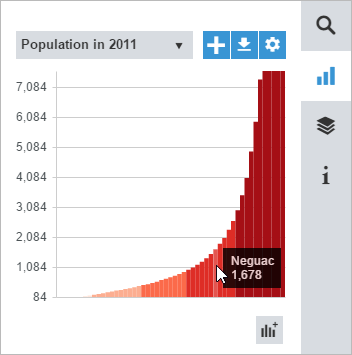
- The corresponding value is highlighted in the Charts.
- The range of value or the category in which the map feature falls is highlighted in the Legend.
Note that this interactivity works both ways. For example, if you mouse over a row in the Data panel, a value in the Chart or an item in the Legend, and the corresponding map feature will be highlighted.
Tooltip
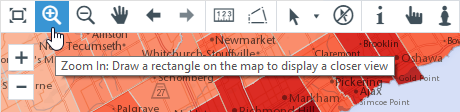
If you mouse over any tool or menu of the interface, a tooltip will provide helpful information.
Tools Visibility
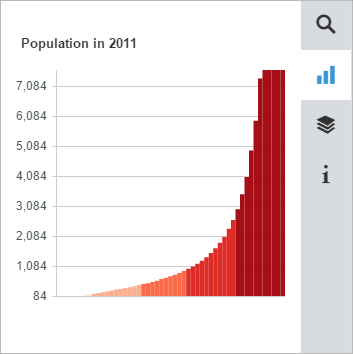
In order to keep the interface minimal and simple, the map and panel tools are only displayed when you mouse over each section of the interface.
|
Regular state of a panel |
When mousing over this panel |
|---|---|
|
|