Charts

The Charts panel is used to view the thematic data graphically.
Interactivity
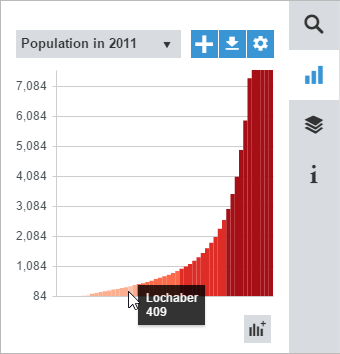
- The name of the thematic data is displayed as the title of the chart.
- If a thematic analysis is currently displayed on the map, the same colors will be used in the corresponding chart.
- When mousing over a chart item, a data tip is displayed on the chart and the corresponding map feature is highlighted on the map.
Tools

|
Use the chart name drop-down to view another chart. |

|
Add a new chart to the map. See the topic on Charts Settings for more information. |

|
Export the chart to either a raster image (.PNG) or a vector graphic (.SVG). When exporting to vector format, the content can be scaled without impacting the quality. |

|
Access to the Charts Settings. |

|
Add a new chart area. |

|
Remove a chart area. |