Selection

The Selection panel displays the list of selected map features. The panel's tab indicates the total number of features that are selected between parenthesis.
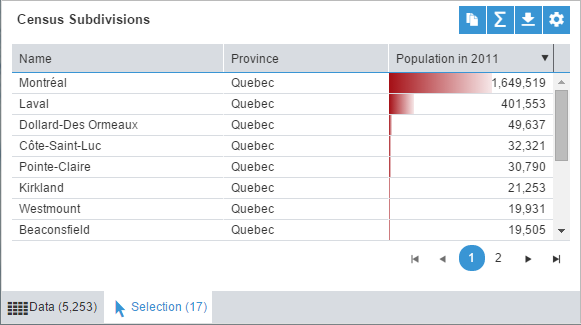
Interactivity
- When displaying numeric thematic data, bar charts are included in each row to help view and compare values in the data set. If a thematic analysis is currently displayed on the map, the color used in the bar charts of the corresponding thematic data column are the same as the colors used in the legend.
- To sort rows in alphabetic or numeric order, click on the column title.
- To resize a column, click on the border of the column and drag to the desired width.
Tools

|
Copy data to the clipboard. |

|
|

|
Export the data to a Microsoft Excel Spreadsheet. You need to specify a file as the output. |

|
Access to the Data Settings. |
Paging

|
Go to the first page. |

|
Go to previous page. |

|
(missing or bad snippet) |

|
See more pages. |

|
Go to the next page. |

|
Go to the last page. |