Data

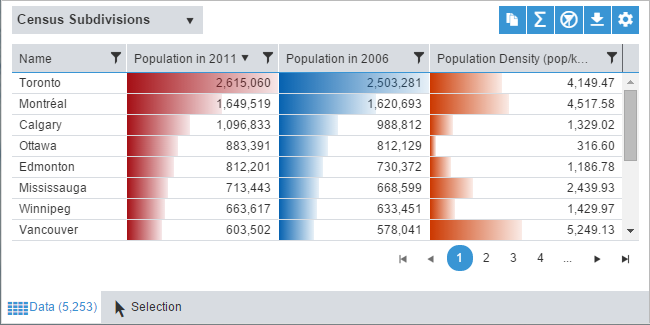
The Data panel helps you gain insights on the relationship between the data and its geography by displaying thematic data. The panel's tab indicates the total number of features of the current layer between parenthesis.
Interactivity
- When displaying numeric thematic data, bar charts are included in each row to help view and compare values in the data set. If a thematic analysis is currently displayed on the map, the color used in the bar charts of the corresponding thematic data column are the same as the colors used in the legend.
- You can click on a row to select it. The row will be highlighted in the data panel, the corresponding map feature will be highlighted on the map and that row will be added to the Selection panel. Note that you can perform a multiple selection using the SHIFT or CTRL keys.
- To sort rows in alphabetic or numeric order, click on the column title.
- To resize a column, click on the border of the column and drag to the desired width.
- You can also Filter the rows on any data column to display only a subset of data.
Tools

|
Select the layer from the drop-down for which to view the data. |

|
Copy data to the clipboard. |

|
|

|
Clear all filters for the current layer. |

|
Export the data to a Microsoft Excel Spreadsheet. You need to specify a file as the output. |

|
Access the Data Settings. |
Paging

|
Go to the first page. |

|
Go to previous page. |

|
(missing or bad snippet) |

|
See more pages. |

|
Go to the next page. |

|
Go to the last page. |