FERC Order 2023: Public Heatmap Requirements
Discover how CartoVista can help your organization create FERC-compliant heatmaps and take your operational efficiency to the next level.
Discover how CartoVista can help your organization create FERC-compliant heatmaps and take your operational efficiency to the next level.

The Federal Energy Regulatory Commission (FERC) has unanimously issued Order No. 2023, a highly anticipated reform aiming to streamline interconnection agreements and procedures under Open Access Transmission Tariffs.
This move seeks to expedite the development of electric generation projects, addressing the backlog in interconnection queues, seen as a hindrance to transitioning to a more sustainable grid. Currently, the interconnection process takes around five years on average, a 40% increase from just a few years ago. Order No. 2023’s impact will affect developers at all stages of the interconnection process. Nevertheless, Order 2023 promises substantial changes in interconnection processes across various regions.
FERC Order 2023 mandates that transmission providers enhance the information accessible to developers for informed decision-making regarding the location and other aspects of their proposed facilities.
Transmission providers will need to:
Not sure which steps you need to take to comply with FERC Order 2023?
To help ISO’s, RTO’s and other transmission providers get more information on what data and consulting processes are needed to deploy FERC Order compliant maps, CartoVista has developed a comprehensive self-assessment readiness guide.
This document includes important information on the steps that are required to successfully deploy interactive maps that comply with FERC Order 2023.
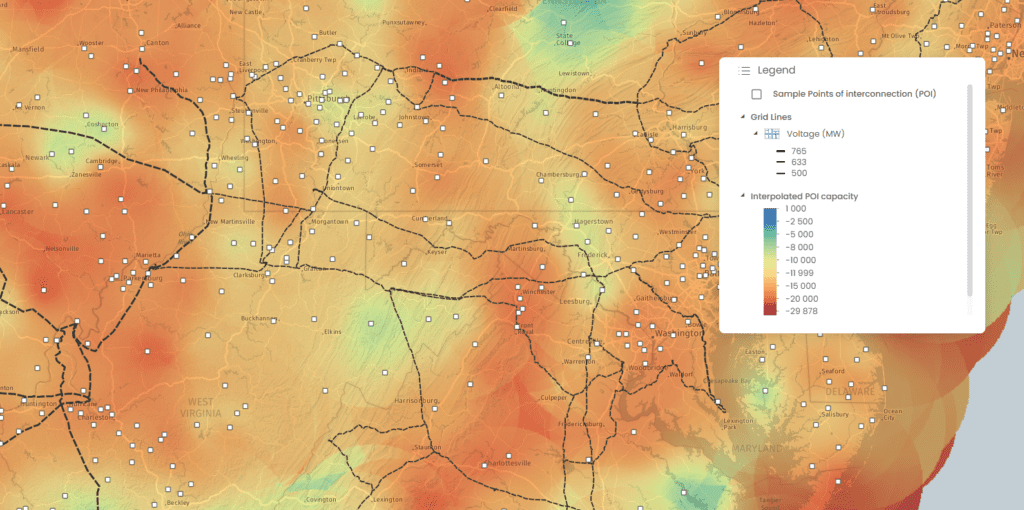
Midcontinent Independent System Operator (MISO) embarked on a groundbreaking initiative in 2021 to confront challenges hindering developers and transmission providers. Collaborating seamlessly with CartoVista, MISO not only pioneered intuitive Point of Interconnection (POI) heat maps but also set the industry benchmark for the FERC Order 2023. As such, MISO was one of the first transmission providers to create compliant public generator Interconnection Queue and Capacity Heat Maps, greatly enhancing access to interconnection information.
Both of these interactive maps were created using CartoVista software, with customized features to ensure an optimal user experience.


The purpose of this map is to help Interconnection Customers pre-screen for potential points of interconnection.
It shows the current capacity (in MW) of the Midwest ISO footprint as a heat map.
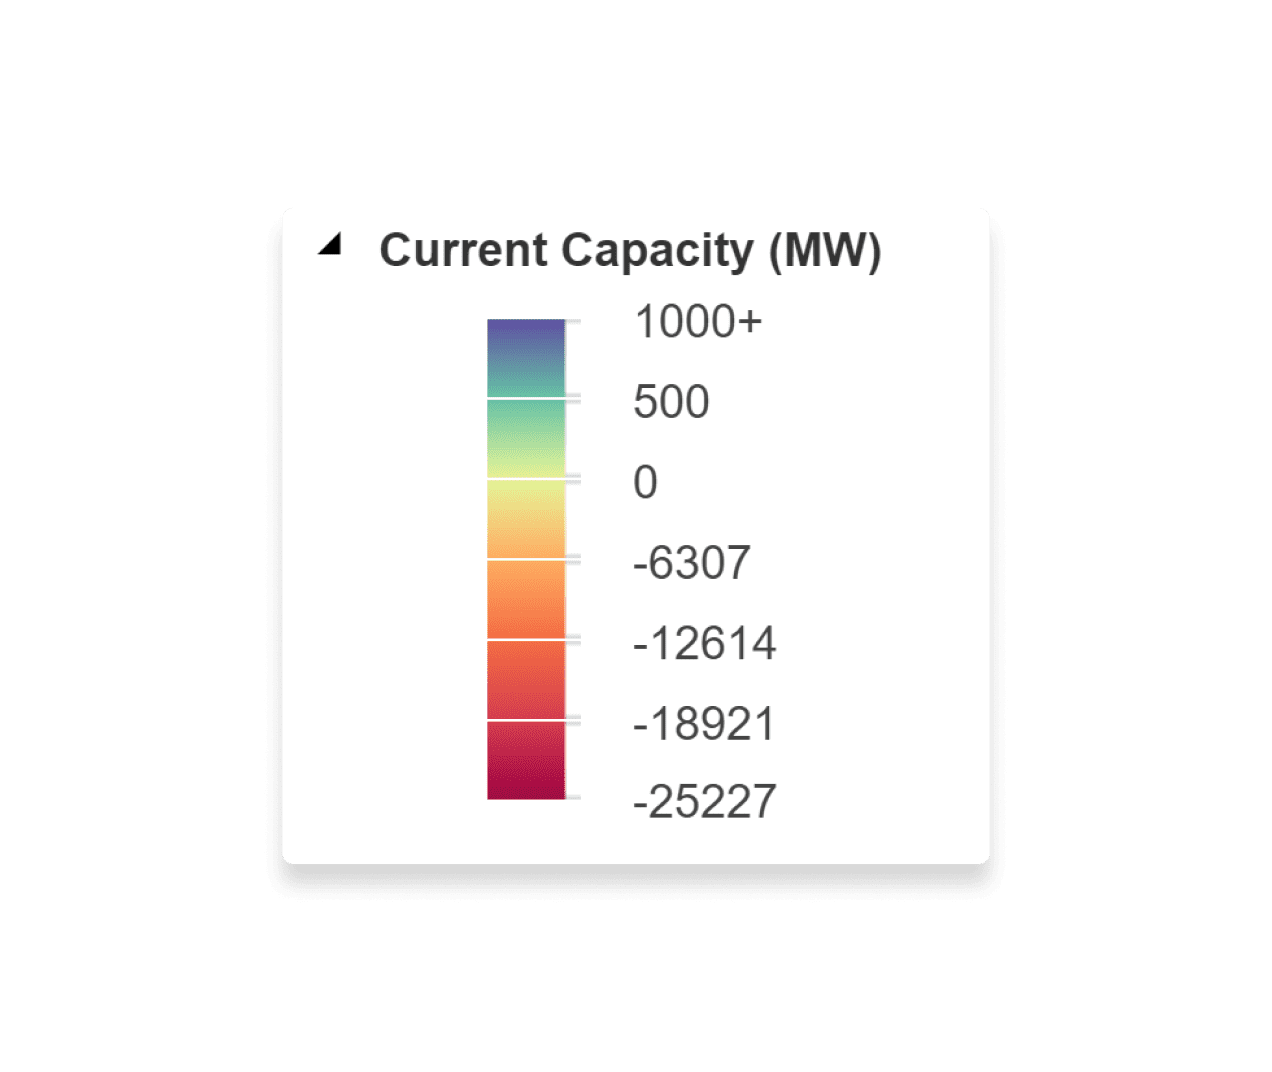
In the heat map, distinct colors represent varying levels of MW capacity. Hot colors, such as red, indicate a lower or negative capacity, while cool colors, like blue, signify a higher capacity.
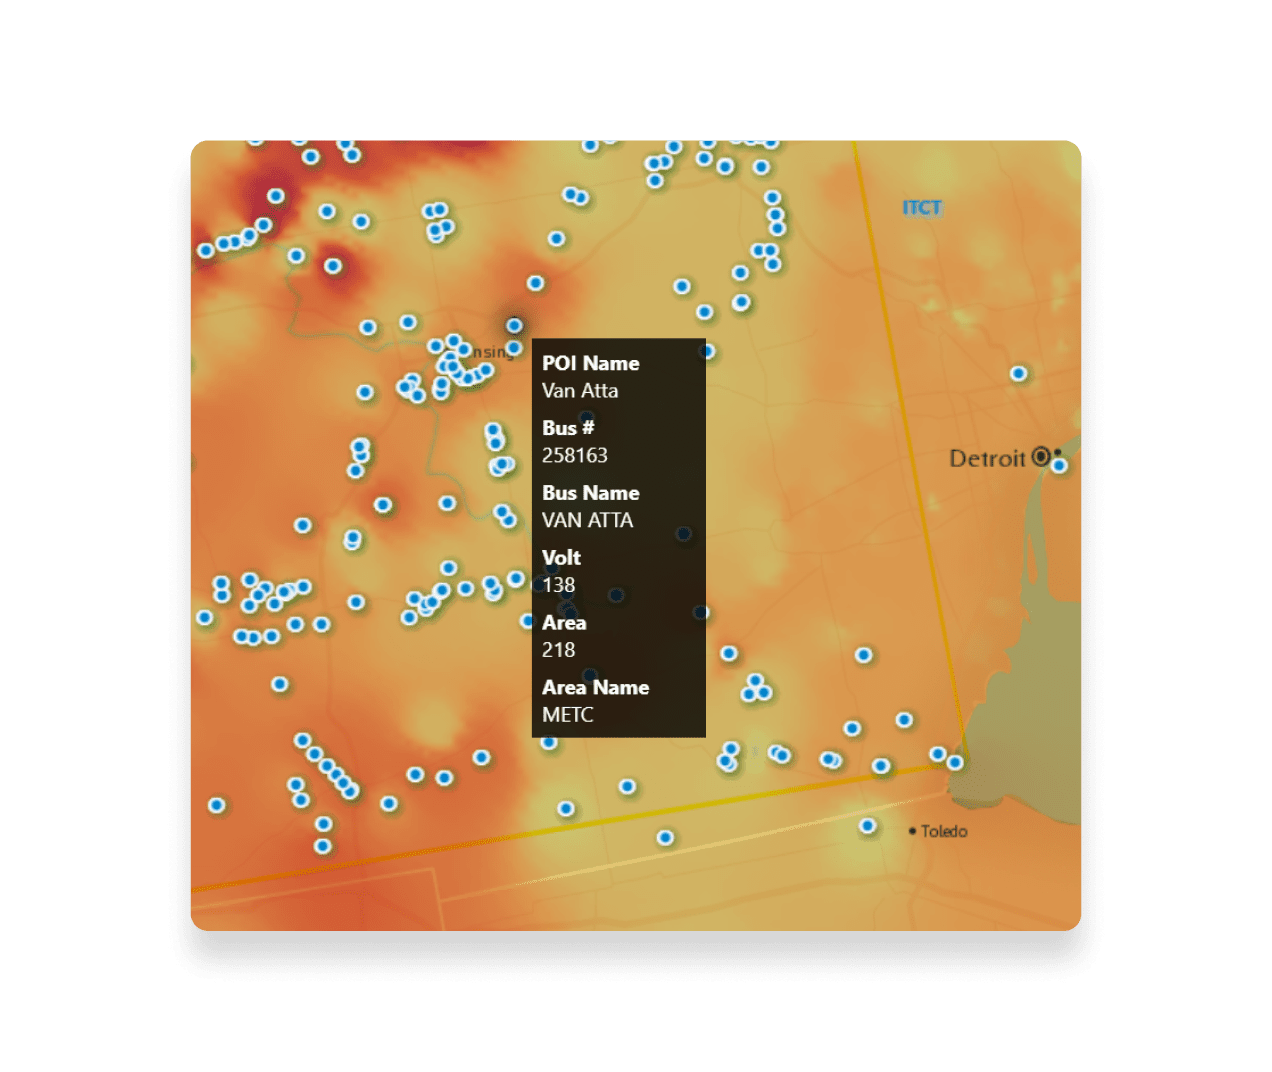
The Points of Interconnection (POIs) are displayed on the map using circle symbols. POIs include attribute information such as:
Assessing network availability for current and expected capacity after the introduction of a generator, involves several key steps in a POI analysis.
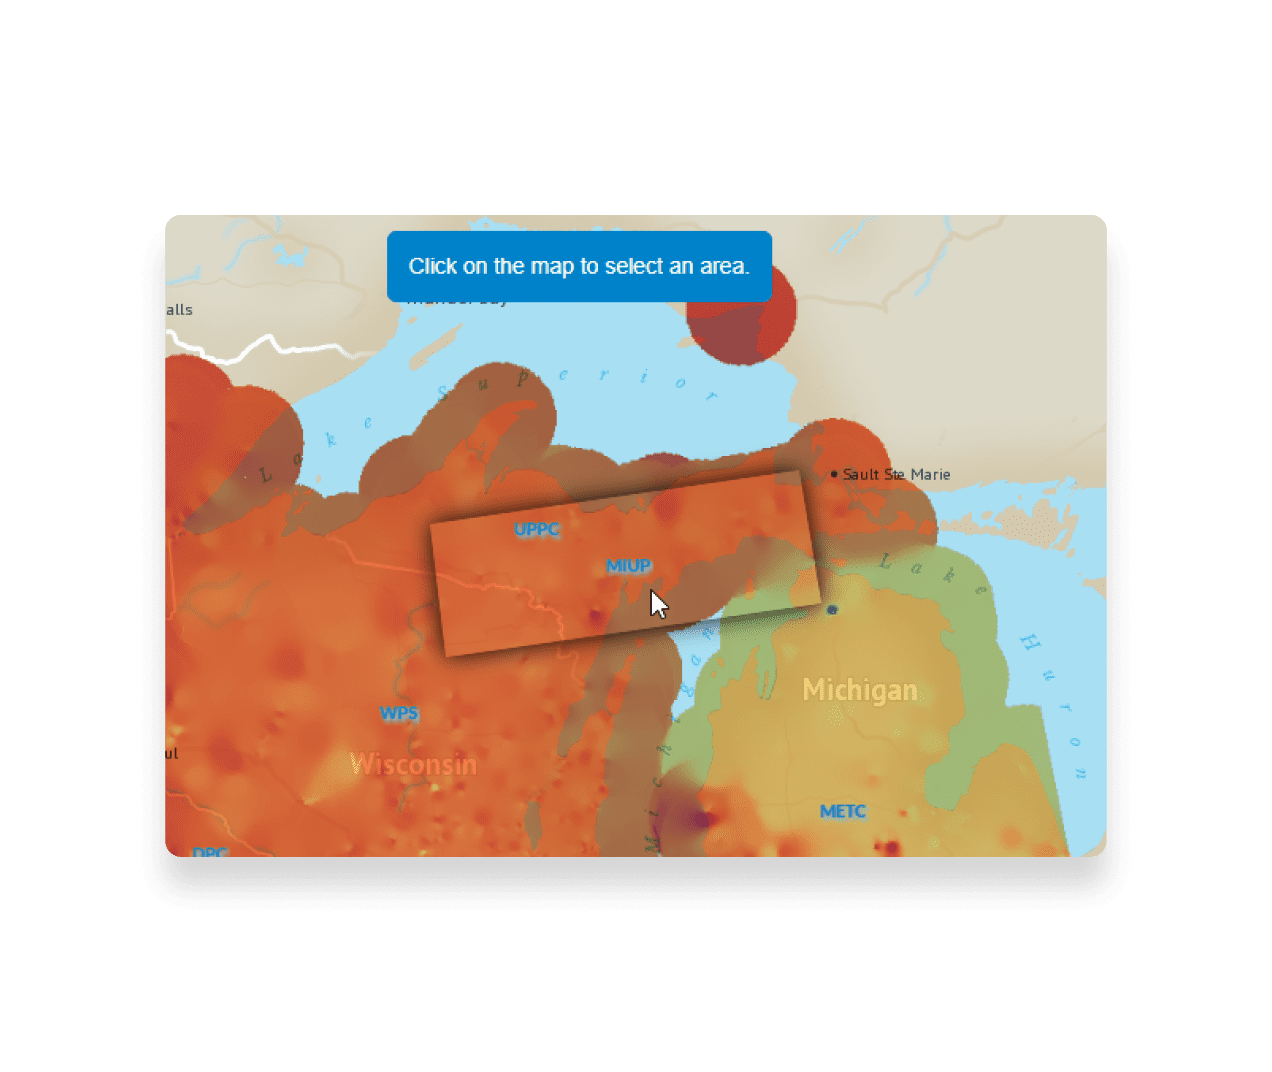

Select an Area – The MISO footprint covers multiple states. To begin the analysis, end users need to choose a specific area on the map that they want to work with. This selection will serve as the focal point for assessing network capacity.
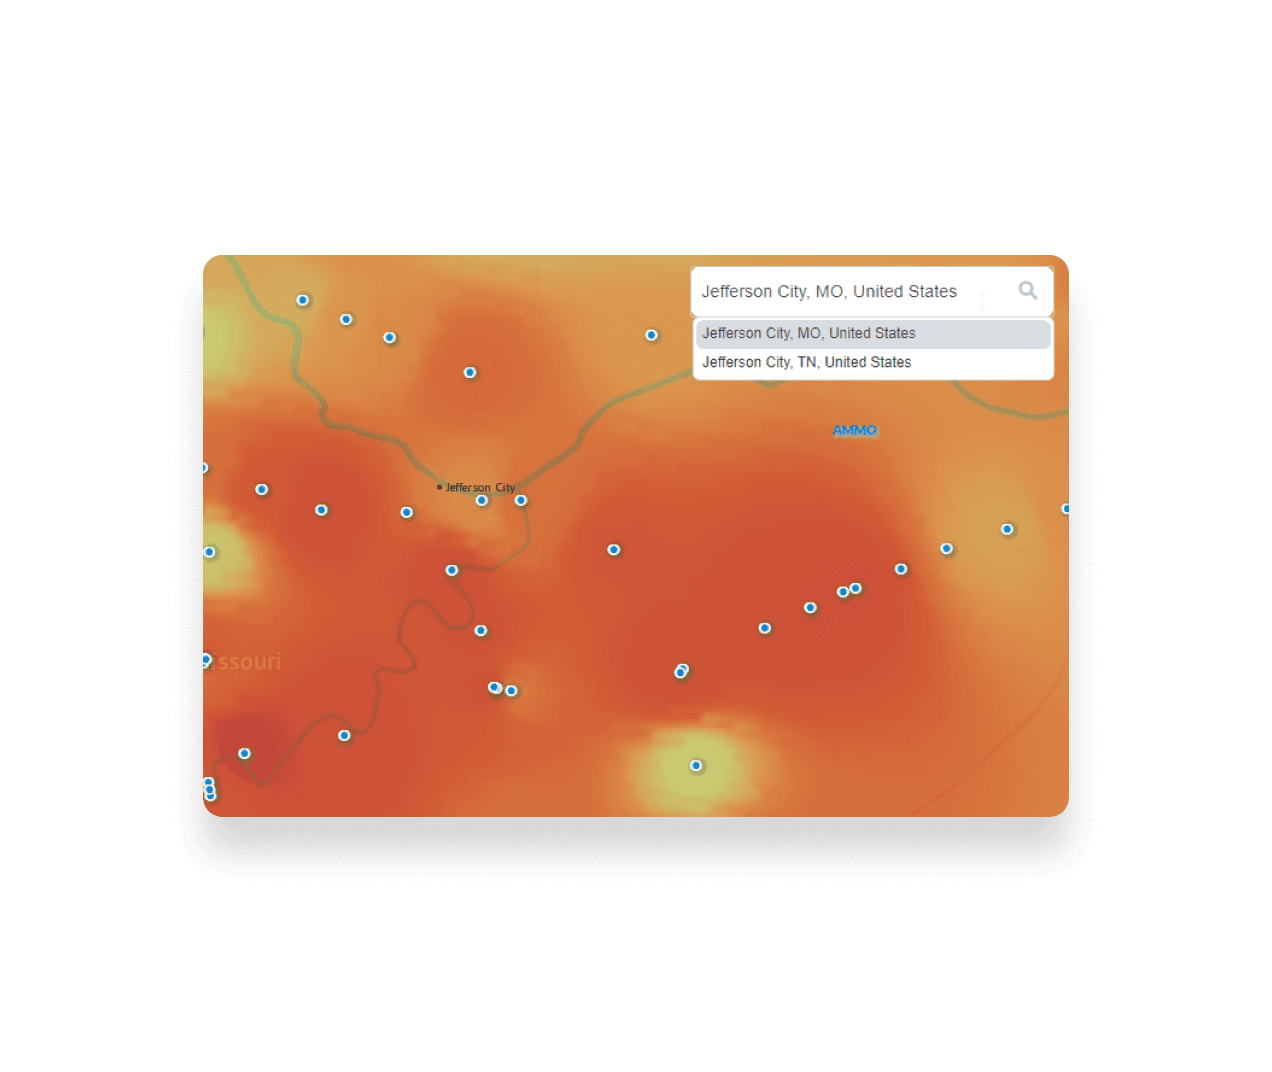

Search – Users can also search for a city or place name using the search box in the map. The results are displayed in a dropdown list.
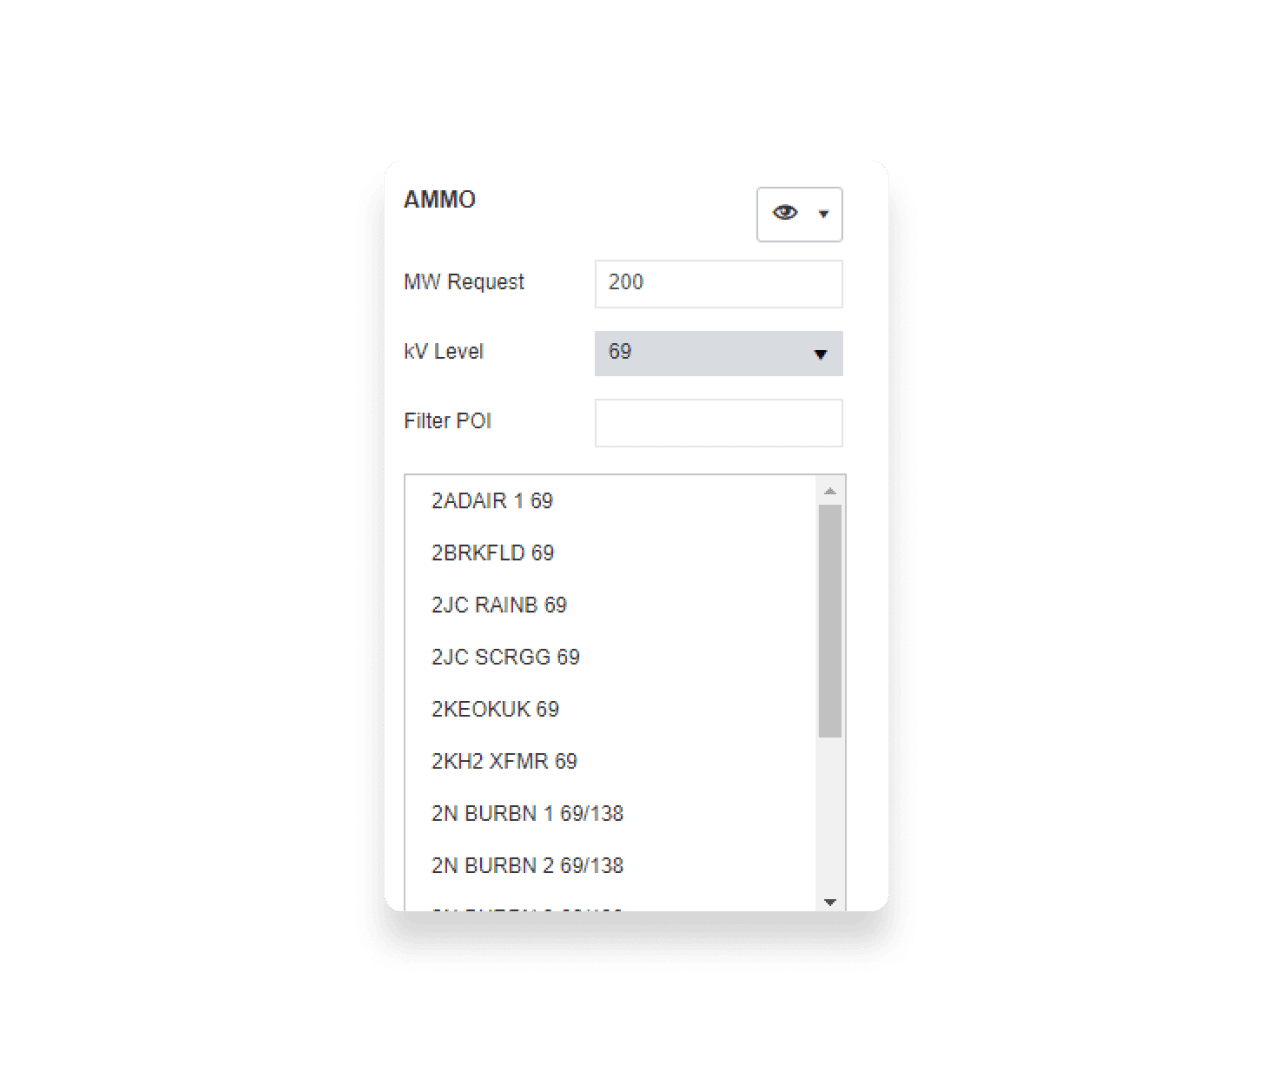

Specify MW Request – It’s essential for users to input the amount of megawatts (MW) they are requesting for your project. This step is mandatory to initiate the analysis accurately.
Filter POI List: Users have the option to refine their Points of Interest (POI) list by selecting a desired kV level and entering a specific POI name. This allows for tailored analysis based on their own requirements.


Initiate Analysis – Once users have set their parameters, they can initiate the analysis by clicking on a specific POI point directly on the map.


Review Summary – After analyzing several POIs, users can access the facilities and summary tabs within the table. Here, users can view a consolidated overview of the analysis results, providing a comprehensive perspective on network capacity across the selected areas. The monitored facilities that are overloaded are displayed in red in the table and on the map.
In summary, the process of assessing network availability for generators involves selecting an area, specifying MW requests, filtering POIs based on kV levels and names, initiating the analysis, and reviewing the results summary. These steps enable informed decision-making when evaluating network capacity in various scenarios.
The Generator Interconnection Queue also holds significant importance in the process of connecting new generating facilities to the electrical grid. It provides a structured and equitable system that determines the order of interconnections, ensuring fairness among developers. Moreover, it offers valuable insights for grid operators, utilities, and stakeholders.
This queue is instrumental in efficient resource planning and grid management. By understanding project positions and expected capacities within the queue, grid operators and utilities can make informed decisions regarding resource allocation, grid upgrades, and system reliability enhancements. It helps optimize the overall planning process.
The goal of this interactive map is to streamline the interconnection process by reducing delays and uncertainties but also promotes renewable energy integration. It aids in the orderly connection of intermittent renewable energy sources like wind and solar, contributing to grid stability as these sources become operational.
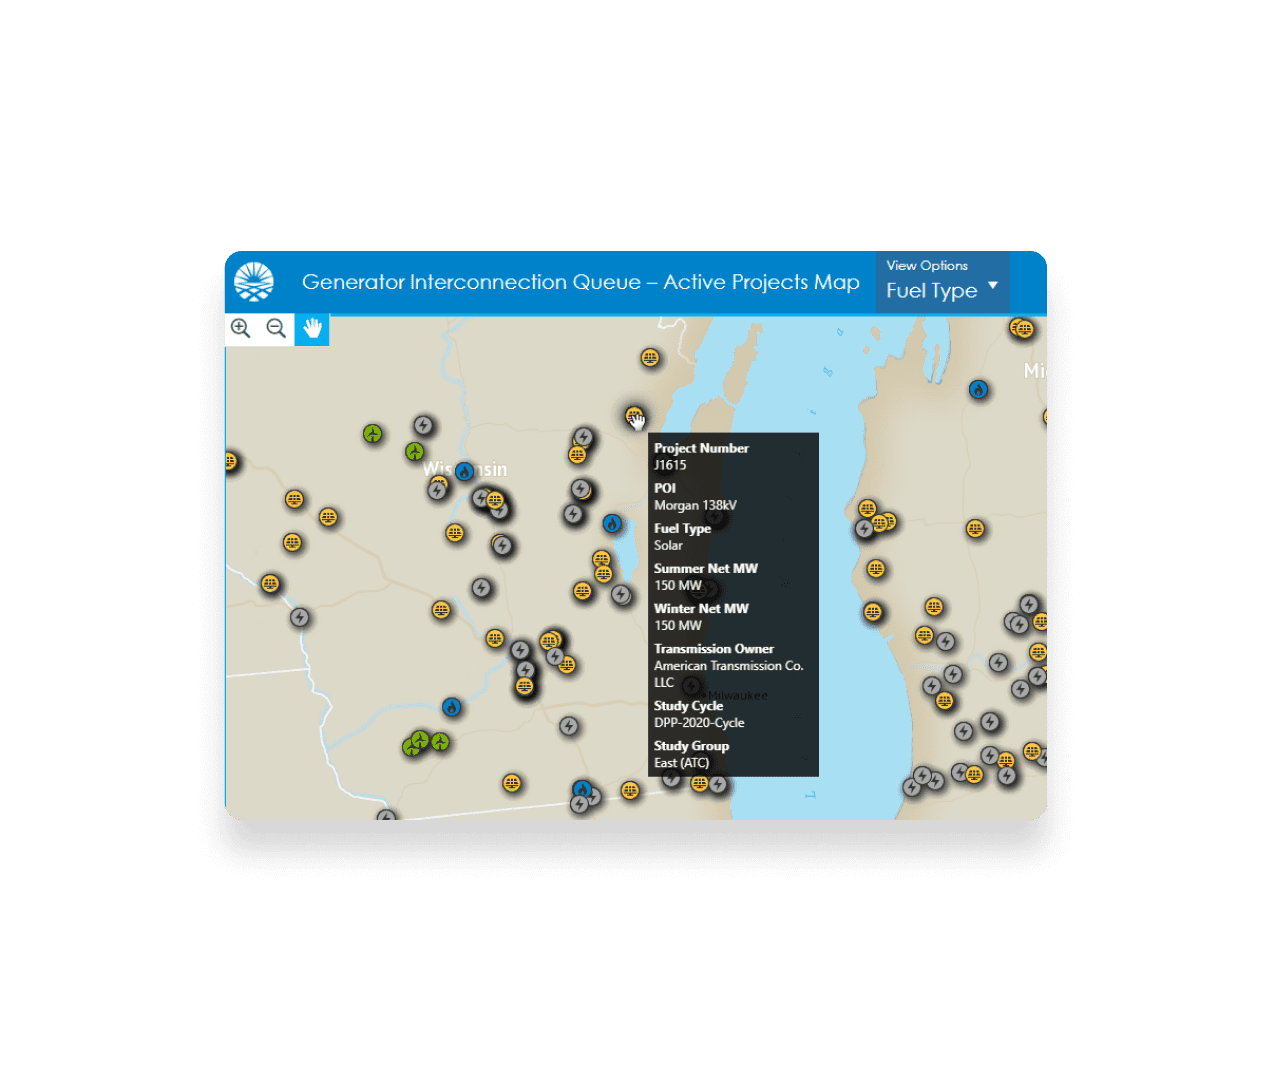

This interactive map allows to visualize the Generator Interconnection Queue with filters for the Study Cycle and Generator Type. Each point includes information such as:
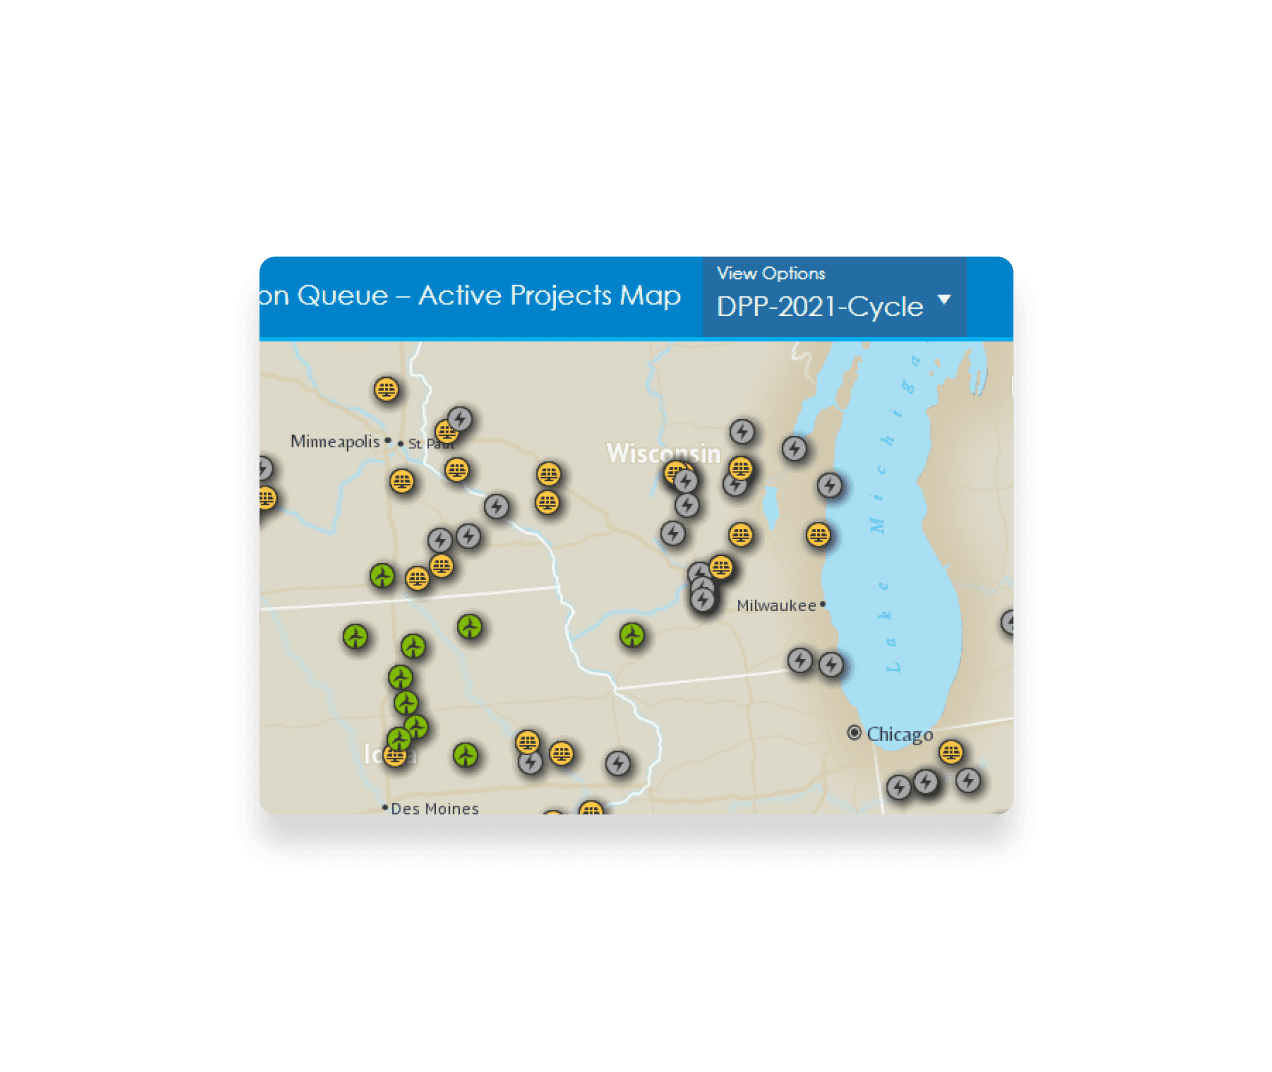

Active Projects by Fuel Type
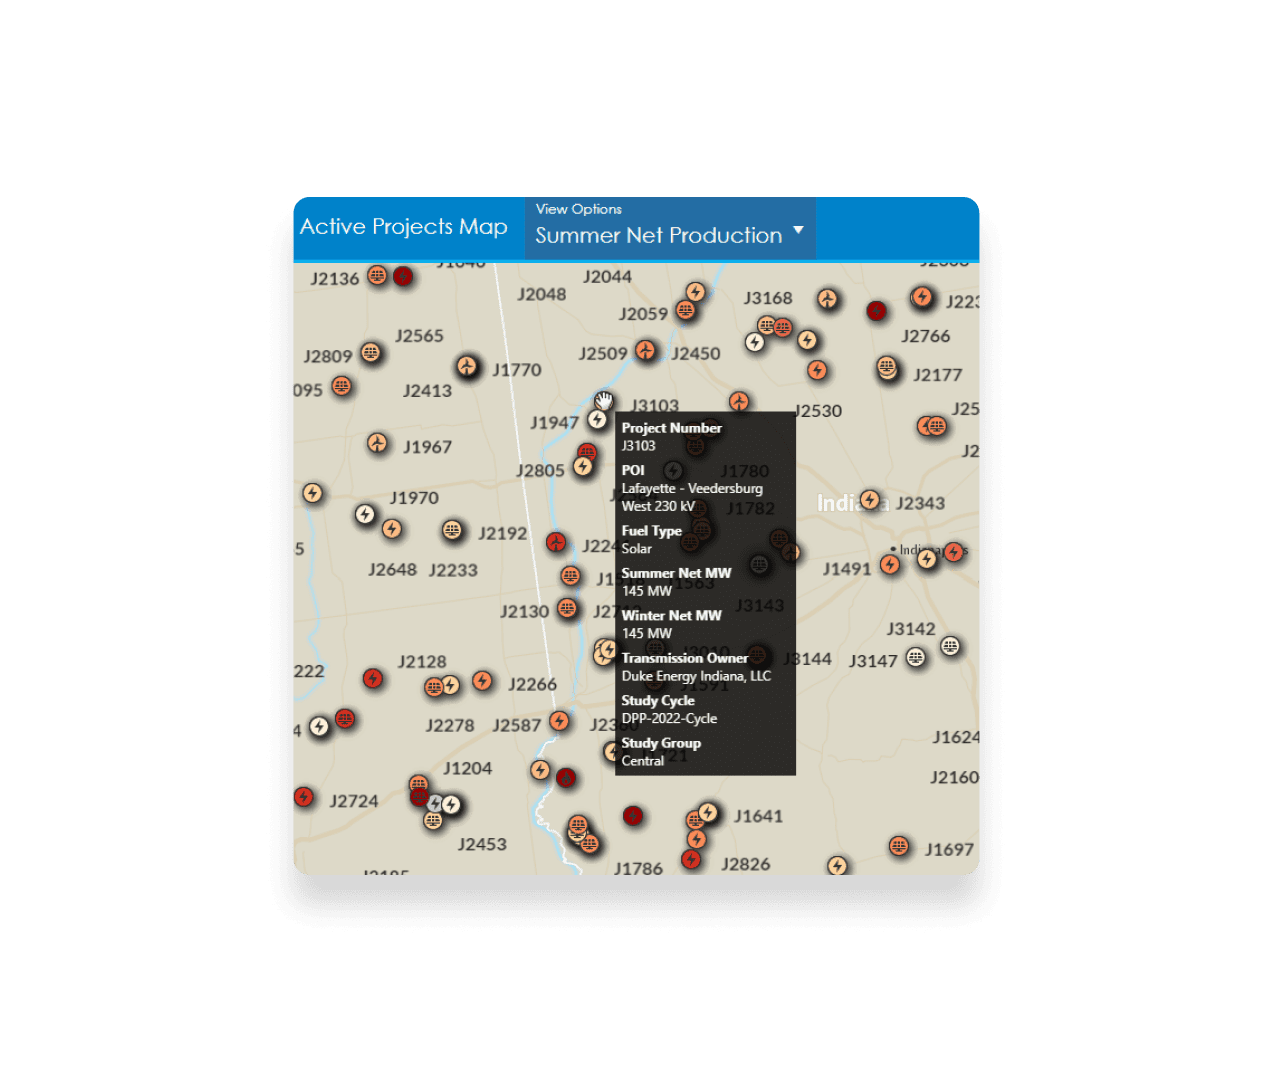

Summer Net Production Theme by Color
In summary, this public-facing Generator Interconnection Queue map ensures fairness, transparency, efficiency, and effective resource planning in the interconnection process. It benefits developers, grid operators, utilities, and stakeholders, ultimately supporting the transition to a more sustainable and reliable electrical grid.
CartoVista can help your organization deploy interactive maps that are fully compliant with FERC Order 2023. Here’s why clients love our platform.
CartoVista is designed with the user in mind, ensuring ease of use without compromising on functionality.
Tailor the map experience to suit your organization specific needs and preferences.
The CartoVista platform is designed to scale and offer the best online experiences either in the cloud or on your own premises.


Leverage the power of data to make informed decisions and streamline all your transmission planning communications with interactive maps.
Enhance the user experience by crafting engaging presentation slides and dashboards that tell a compelling story.
Our team of experts is always here to assist you, from initial setup to regular maintenance, ensuring that your project is deployed on time and on budget.
Kindly complete the form to schedule a call with our team of solution experts to explore your requirements and preferred timelines.
Please fill out the form below to get your copy of the FERC Order 2023 Mapping Readiness Guide.