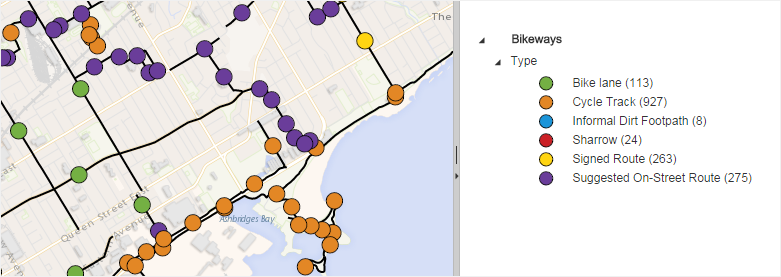
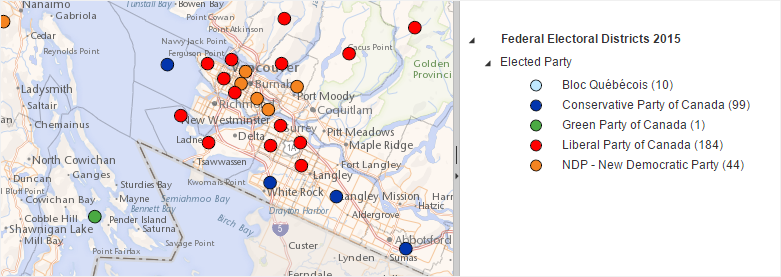
Symbols Color Categories
This type of thematic analysis is commonly used to show categories of a thematic data as a classification, using different colors. It is applicable to polyline or polygon layers with string data. The symbol is displayed at the centroid of each map feature.
Polylines
Polygons
Legend Settings
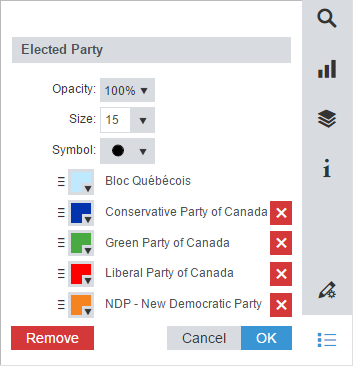
When this thematic analysis is displayed, the Legend Settings are accessible from the Legend panel to customize the thematic analysis name, opacity and the following settings: