Size Ranges
This type of thematic analysis helps you compare the data by displaying size ranges.It is applicable to point or polyline layers with numeric data.
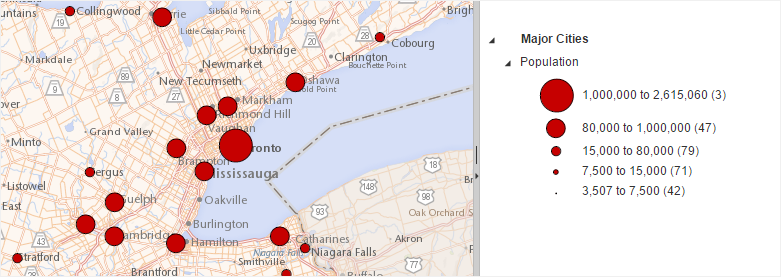
Points
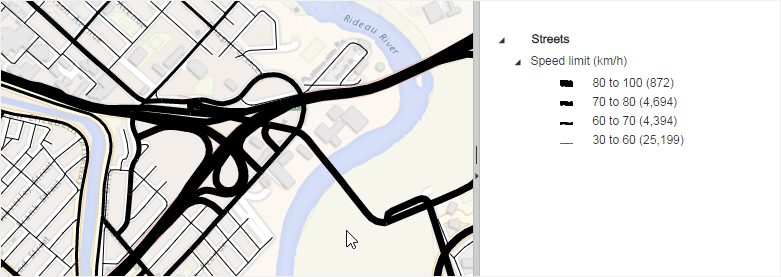
Polylines
Legend Settings
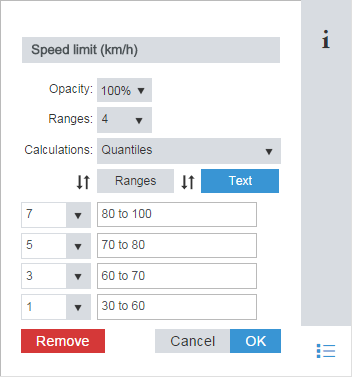
When this thematic analysis is displayed, the Legend Settings are accessible from the Legend panel to customize the thematic analysis name, opacity and the following settings:
|

|
|
|
Select one of the following range calculation method from the drop-down list.
|
|
This method distributes a set of data into groups that contain an equal number of values. This method will never create empty classes or classes with too few or too many values.
|
|
Also referred to as natural breaks classification, this method is designed to determine the best arrangement of values into different classes. This is done by seeking to reduce the variance within classes and maximize the variance between classes. |
 |
This calculation method divides rows across ranges of equal size.
|
|
This measure is used to quantify the amount of variation or dispersion of a set of data values. Each range is defined against the average value, adding or subtracting a standard deviation value for each. |
|
If you modify a range threshold manually, the calculation method automatically change to Custom.
|

|
Reverse the representations
of the size associated with each range.
|
|
Ranges thresholds are calculated automatically using the selected range calculation method. Click Ranges to modify manually each range thresholds by typing a number in the text box.
|

|
Reverse the numeric order of the ranges.
|

|
Click Text to rename each range by typing in the text box.
|

|
Select the map features size from the drop-down list or type the desired size in the text box.
|

|
Restore the default text for the legend item.
|