Symbols Color Gradient
This type of thematic analysis helps you compare the data by applying continuous colors to the map features. The color gradient is defined by 2 colors, for the minimum and maximum value of the data chosen. It is applicable to polyline or polygon layers with numeric data. The symbol is displayed at the centroid of each map feature.
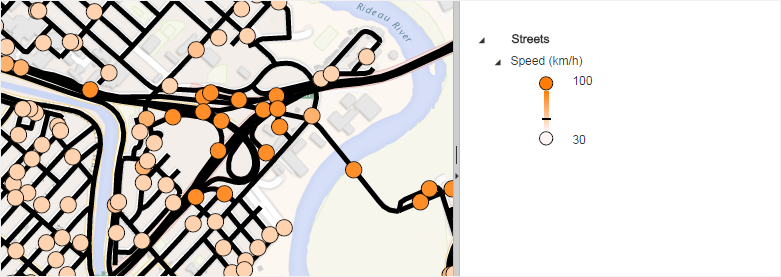
Polylines
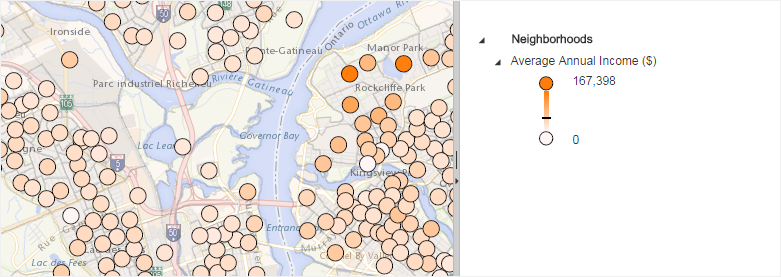
Polygons
Legend Settings
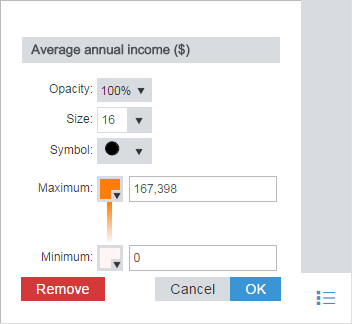
When this thematic analysis is displayed, the Legend Settings are accessible from the Legend panel to customize the thematic analysis name, opacity and the following settings:

|
Select the map features size from the drop-down list or type the desired size in the text box. |

|
Select the shape associated with the legend item. |

|
Set the color. |

|
Modify manually the maximum and minimum values by typing a number in the text box. |
