Clustering
Map features of a point layer can be displayed as data clusters to facilitate the interpretation of very dense layers. Points that are located near each other are replaced by a single circle. The number shown on each circle corresponds to the number of points clustered. The size of each cluster is adjusted dynamically to bring out the most important clusters.
| Layer without data clusters | Layer with data clusters |
|---|---|
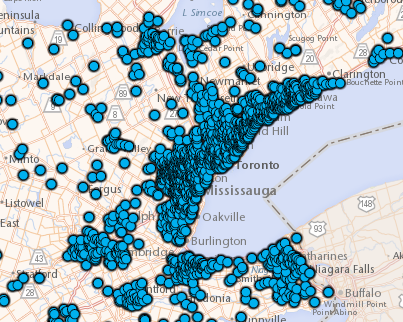
|
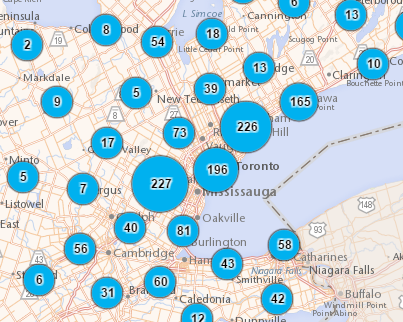
|
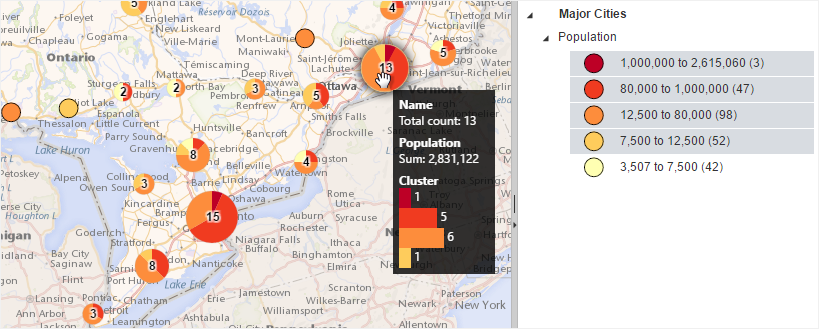
When a thematic analysis by category or range of data is added to this point layer, the clusters are displayed as pie charts. The data tip of a cluster can include the following information:
- total count of points clustered
- sum, average, minimum or maximum value of a numeric thematic data
- distribution of each category or range of thematic data