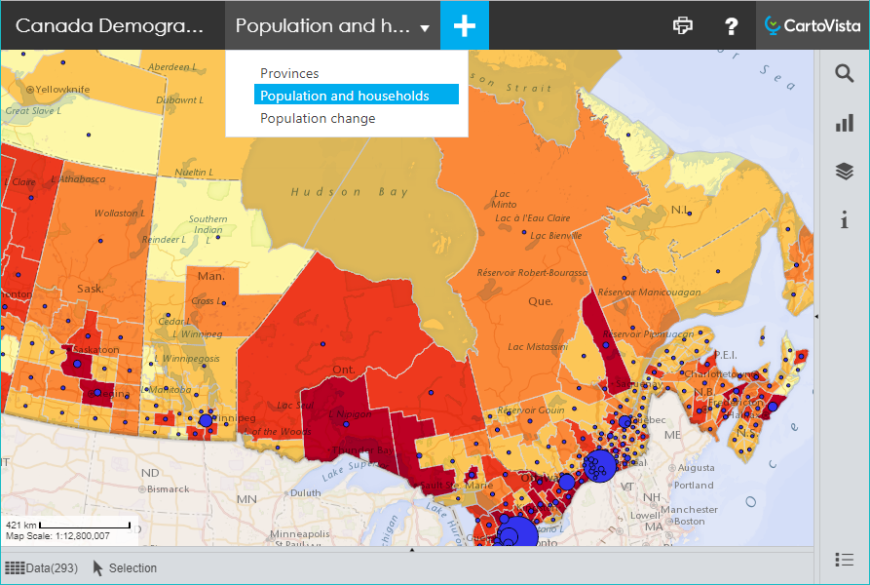
How to configure predefined thematic analyses?
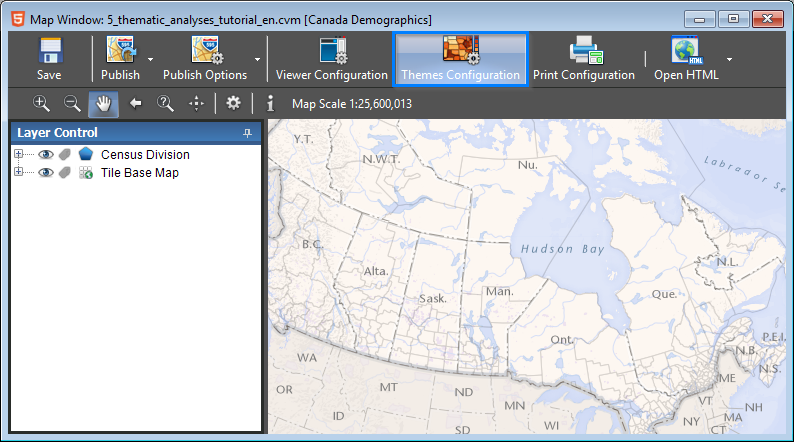
You can now use the added thematic data to create predefined thematic analyses. In the map top bar, click the Themes Configuration button.
Create a Thematic Analysis
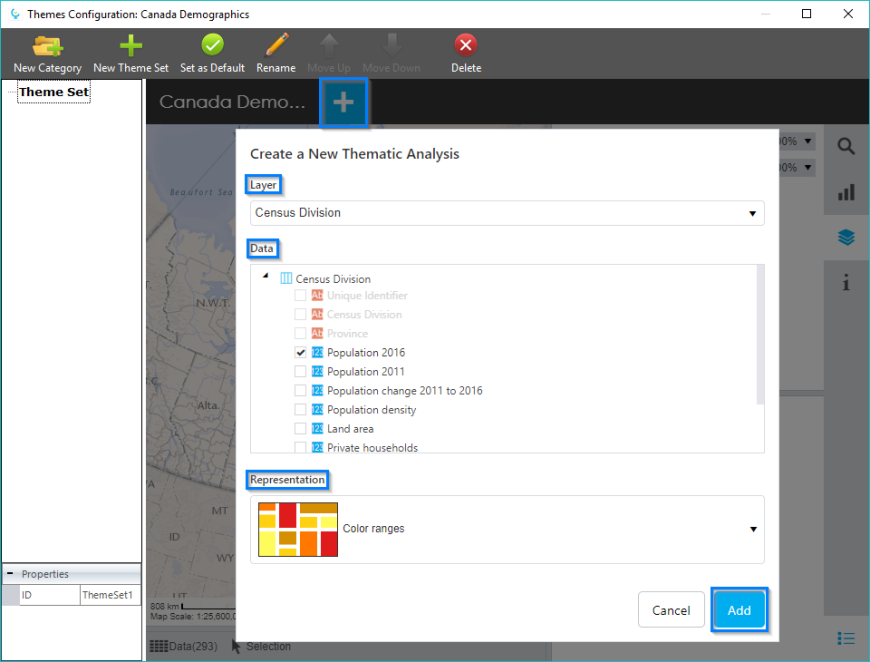
In the Themes Configuration dialog, click on the blue cross to Create a New Thematic Analysis.
- First, select the layer that will be the focus of the analysis.
- In the Data section, check the thematic data that you want to display.
- Select a Representation mode. Note that the range of representations available depends on the format of the chosen thematic data (characters or numeric) as well as the type of geometry of the map layer (points, lines or polygons).
- Click Add.
Thematic Analysis Configuration
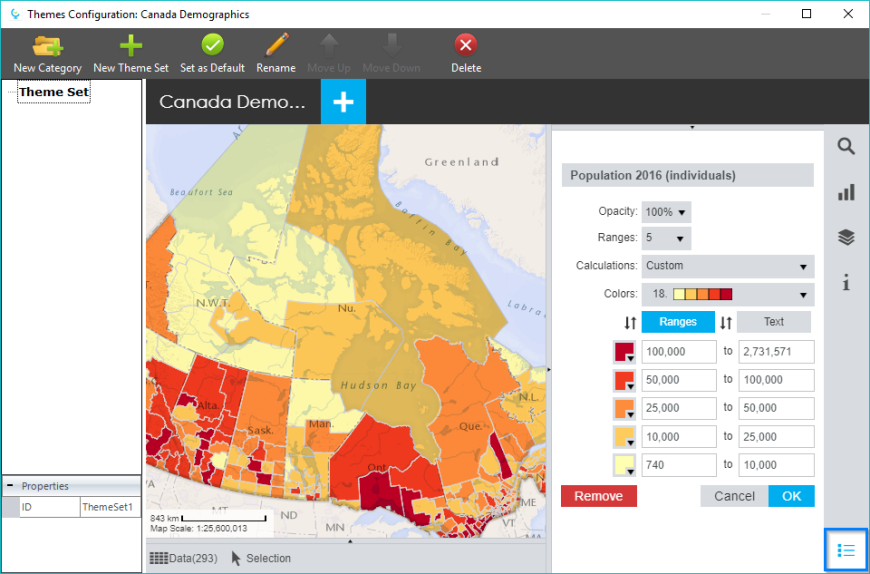
You can then modify the style of the thematic analysis using the legend's configuration options. For example, on a color range thematic analysis, you can change the number of ranges, the color palette, the calculation method and the extents of each range.
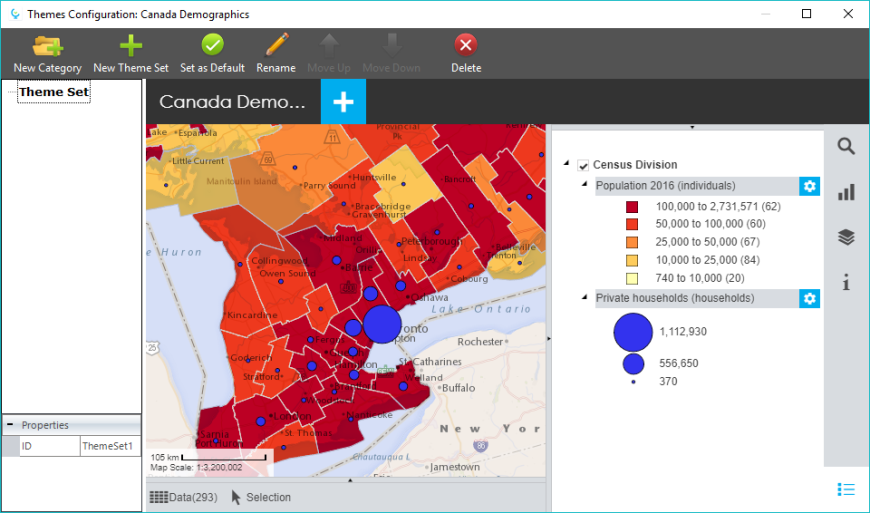
Cross Analysis
You can compare various data by creating more than one thematic analysis on the same theme set. For example, you can display a color range theme on a variable that will be displayed on polygons, and then add a thematic analysis using symbols of graduated size on another variable.
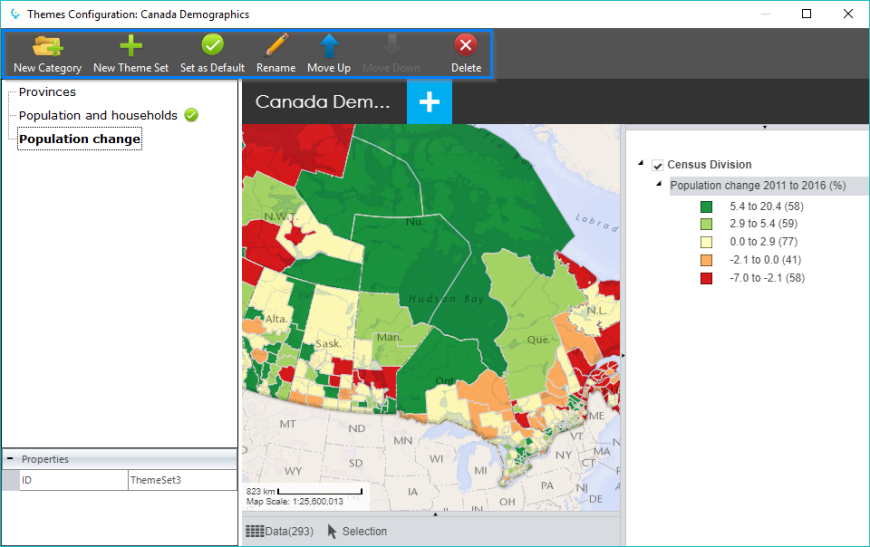
Theme Set Configuration
Using the top bar, you can also:
- Create several theme sets containing different thematic analyses.
- Determine which theme sets will be displayed by default when launching the map.
- Rename and organize the order of theme sets.
It is important to note that any changes made in this dialog will be kept when the dialog closes. Then, simply save the main map window and publish your map to access these themes later in the CartoVista Viewer.