How to add interactivity to your map and data?
Now let's add interactivity to your map. To do this, please note that you must first have defined data.
Interactivity
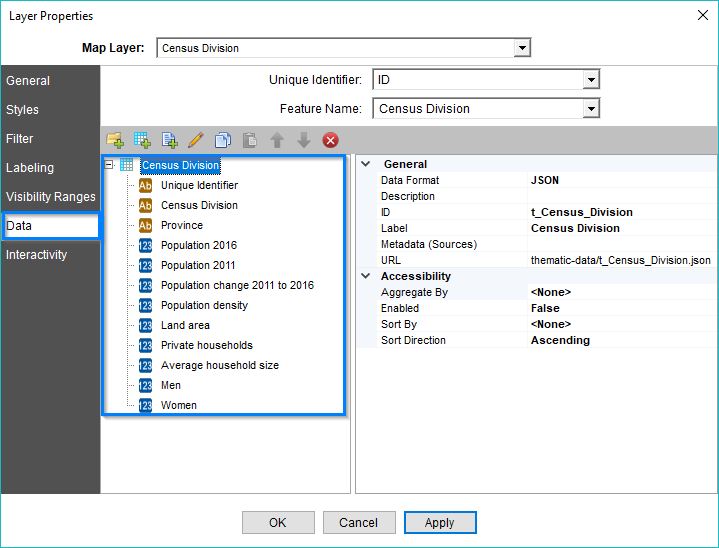
Go to the Interactivity tab in the layer properties dialog of your map. This tab allows you to bring your data to life by enabling the different options for displaying data in the CartoVista Viewer, such as the following:
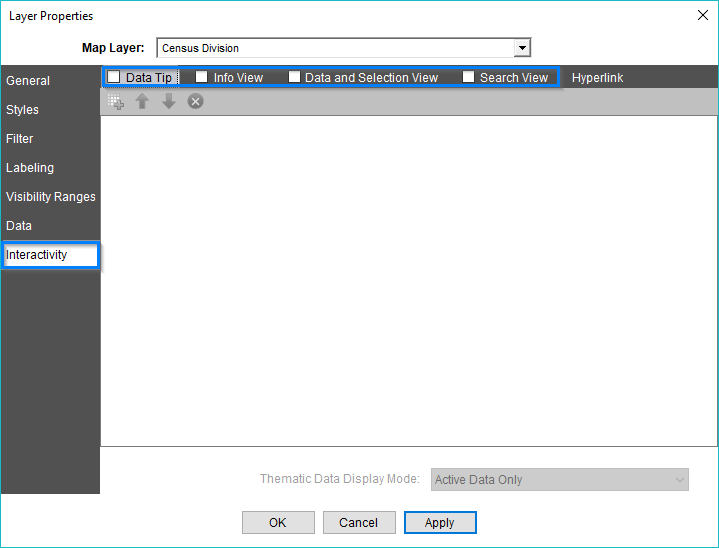
Data Tip
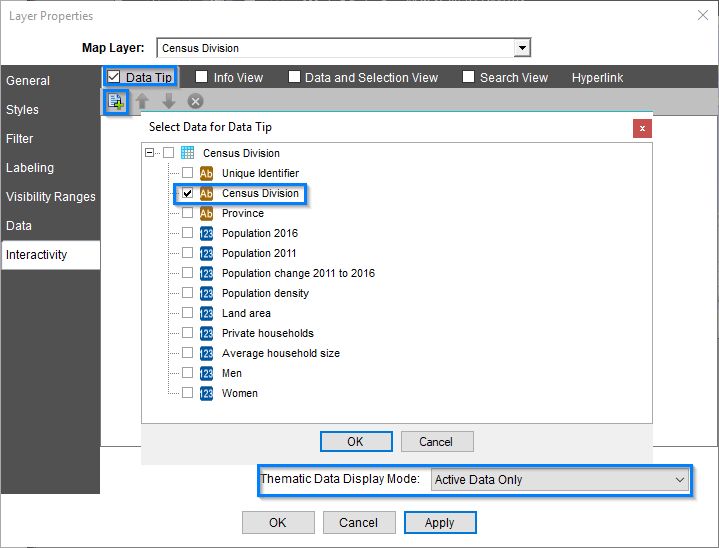
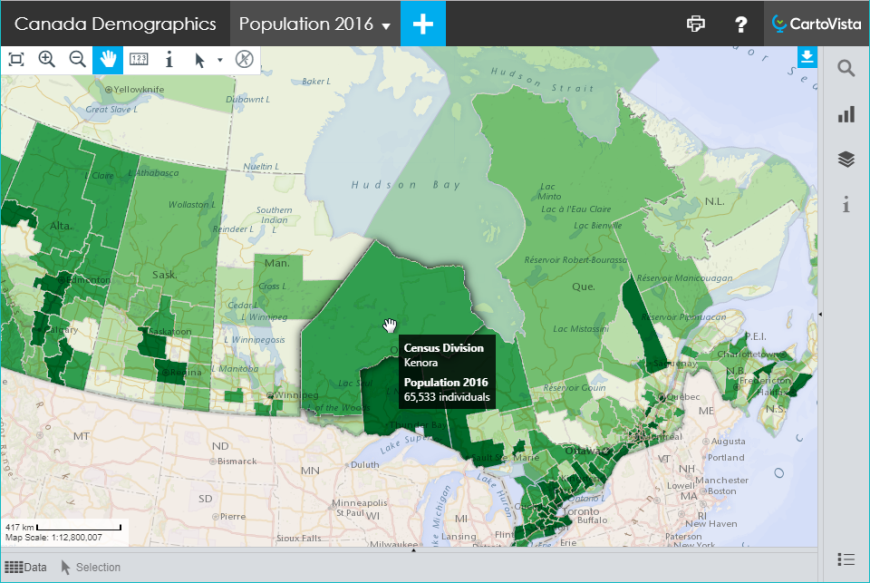
Let's start with the data tip. This option allows you to display information when you roll over map elements. To enable this option, check the box to the left of the Data Tip section, and then click the Add Thematic Data button to choose the data you want to expose in the map. For the data tip, we recommend displaying the names of your map entities. By default, the Thematic Data Display Mode selected at the bottom of the window is Active Data Only. This option ensures that when creating thematic analysis, the statistical data displayed on the map is automatically present in the data tip.
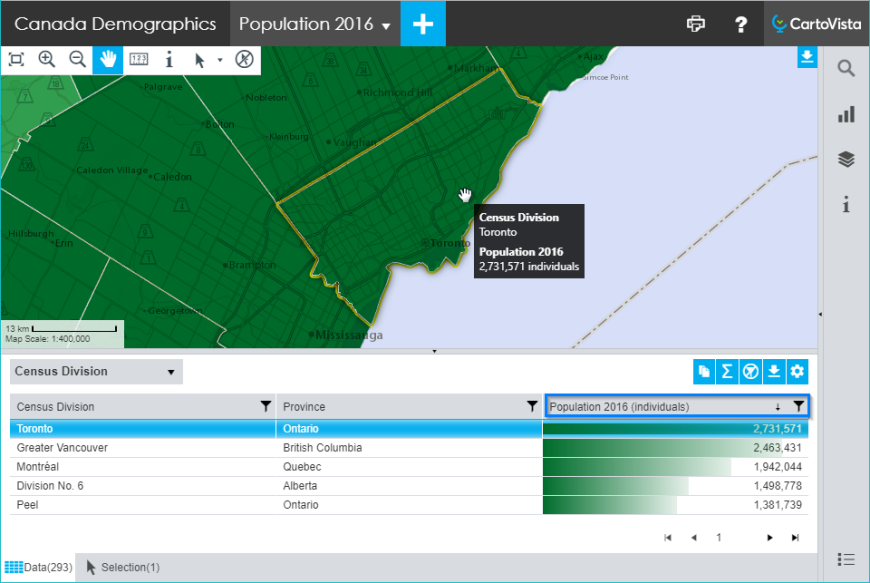
Click OK and Publish your map to view the result in the CartoVista Viewer. When you mouse over the map, the name of each map entity is displayed.
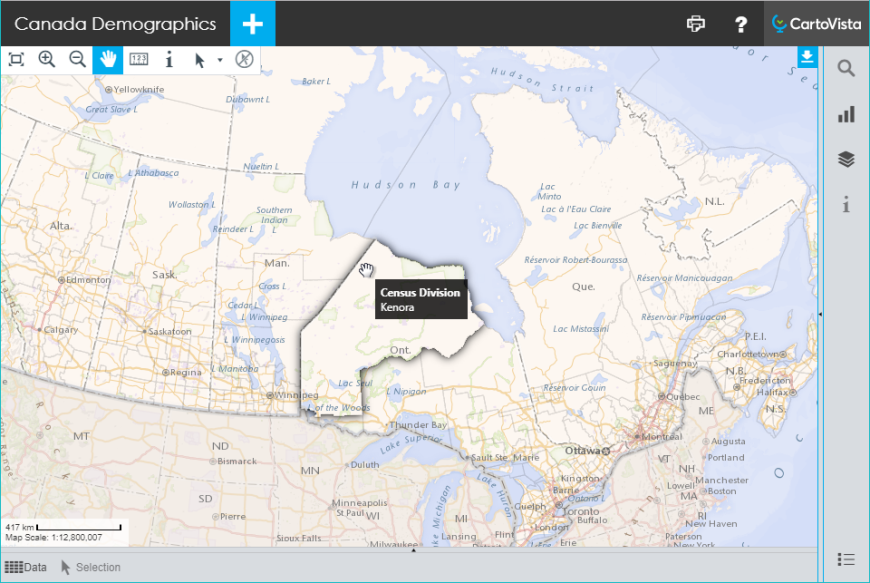
Create a thematic analysis on the fly. When you mouse over, this data is also displayed in the data tip.
Info Tool
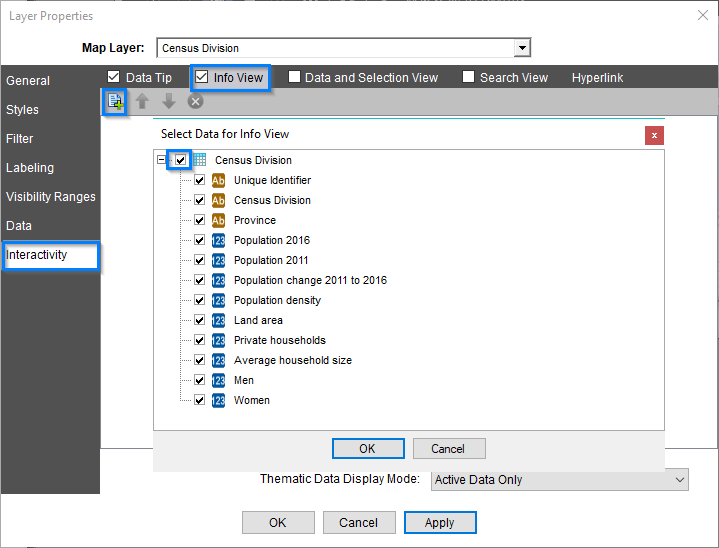
Back in the CartoVista Publisher, go back to the Interactivity tab of the Layer Properties to activate the Info View. Here, we advise you to add all the relevant information that you want to make available to the users of your map. This data will be displayed in the information panel of the CartoVista Viewer.
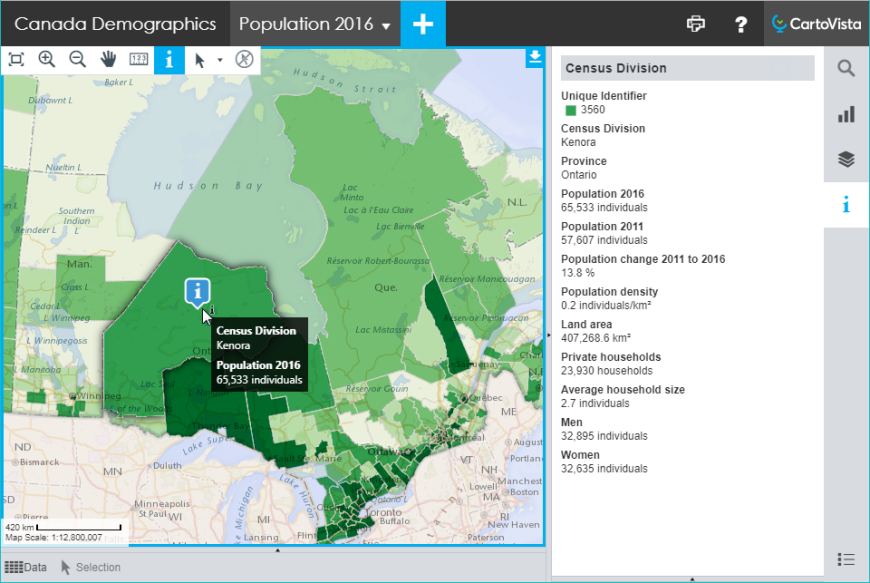
Click OK and Publish your map. To view the Information panel, you must select the Info tool located on the map toolbar and click one of the interactive map entities.
Data Table and Selection
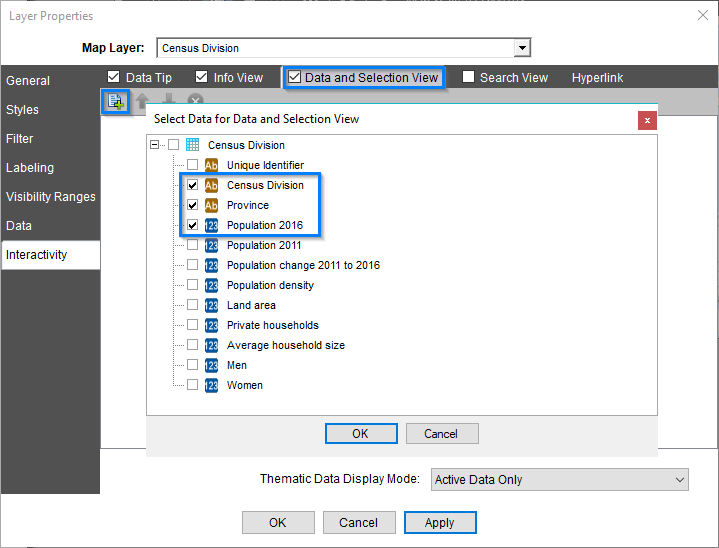
We will now activate the Data and Selection View. Here, we advise you to choose the most impactful data, those on which you want to attract the attention of the users of the map or with which you will be able to filter your data. For example, view current usage statistics, as well as descriptions for categorizing entities.
Click OK and publish your map. The data is visible in the table at the bottom of the map.
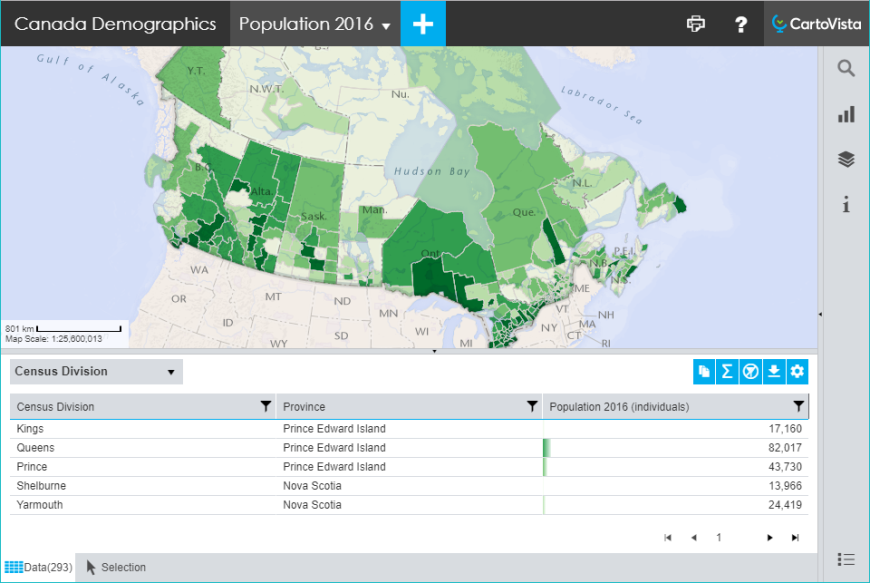
You can sort the data by clicking on the header of each column. If you are more interested in one of the recordings, double-click on it to zoom in on its location in the map.
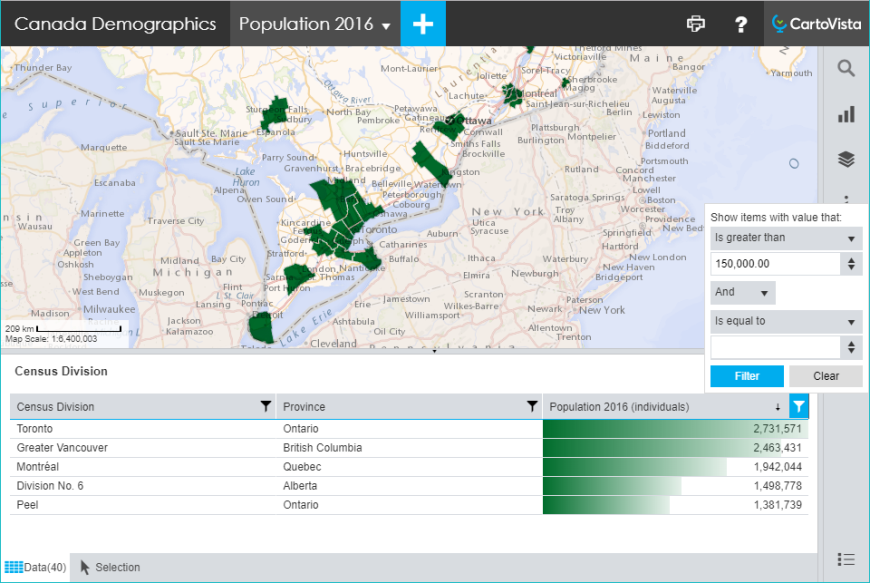
You can also use filters to display only items that match a category, or a specific region.
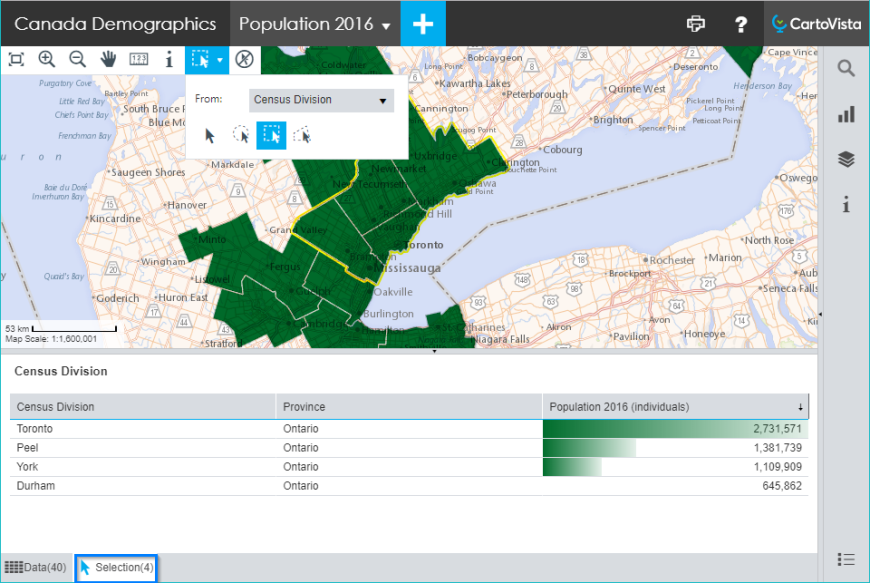
That's not all. By activating the data table, you have also activated the selection. Choose a selection tool from the map toolbar. Select by drawing a rectangle on the map. The selected entities are then listed in the Selection tab at the bottom of the map.
Search
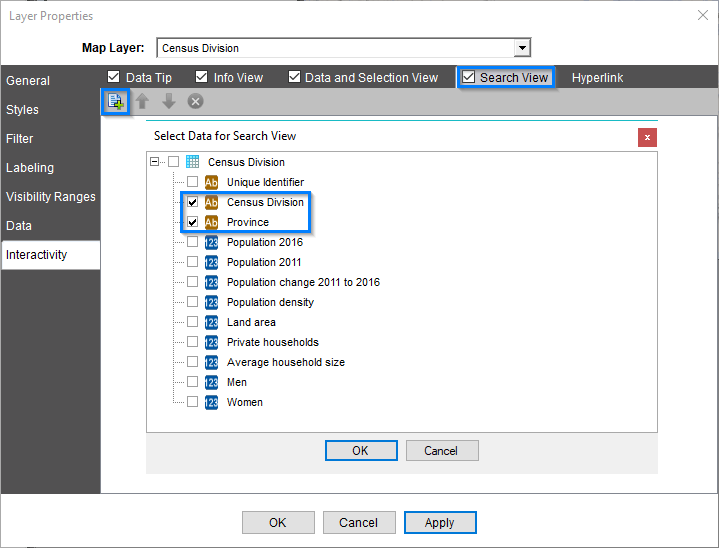
Finally, we will enable the Search View. Here, we recommend selecting the name of the entity, as well as any other data to quickly identify an element.
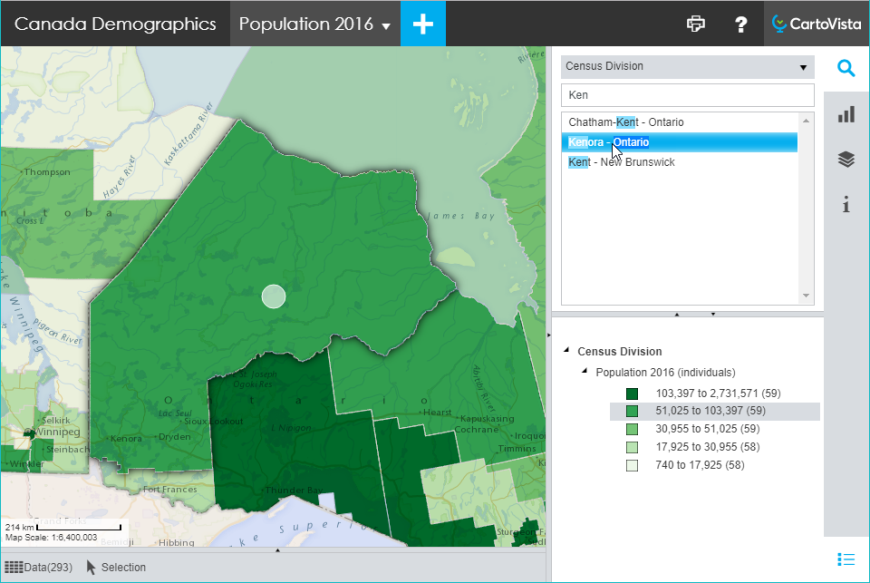
Click OK and publish your map. Access the search panel. Type a few characters of the name of the searched entity. The corresponding list of items will adjust accordingly. Click on one of the items in the list to zoom in on its location in the map.
With just a few clicks, you've exposed the data to your users, who can now easily query the map and quickly get detailed information!