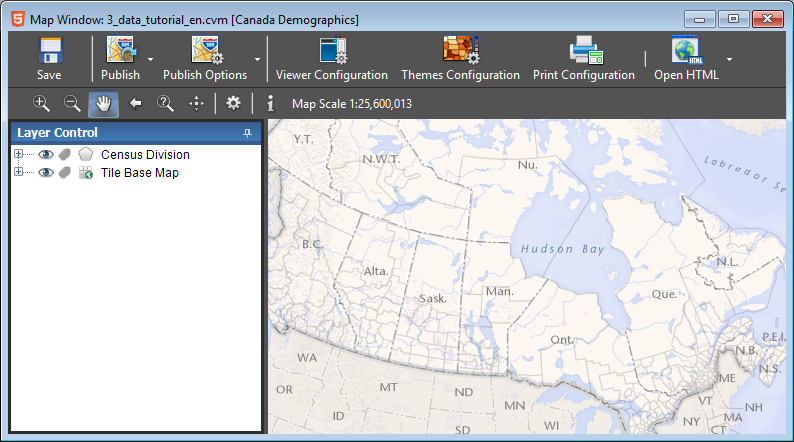
How to define thematic data?
Thematic data is data associated with each of the map entities that you want to view in your map. This data can be used to create themes to analyze the spatial distribution of a phenomenon, for example, to illustrate the distribution of the population in a territory.
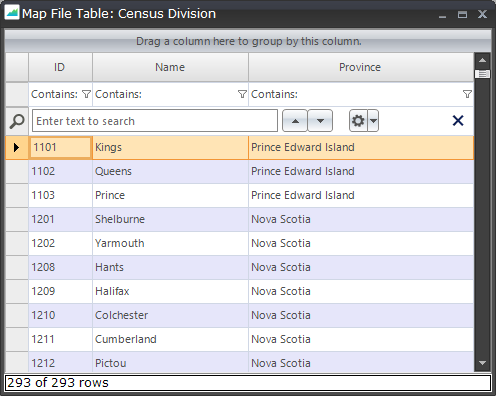
Data Table
Step one: check the data available in your map layers. In layer control, right-click a layer and choose Show Data Table.
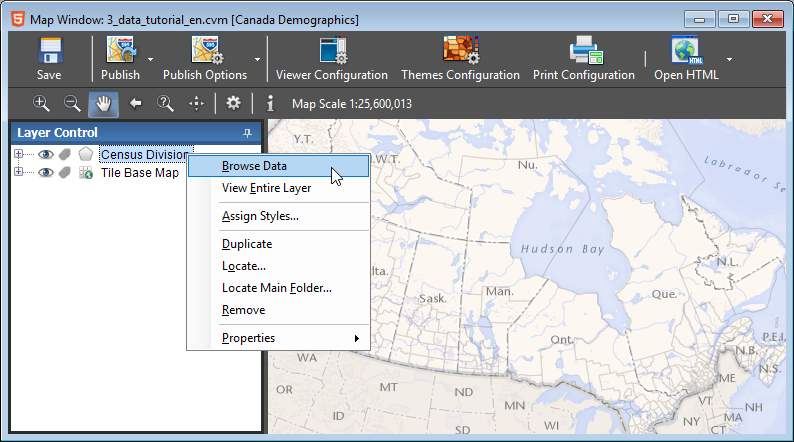
Pay attention to the names of the columns, their type, and their contents.
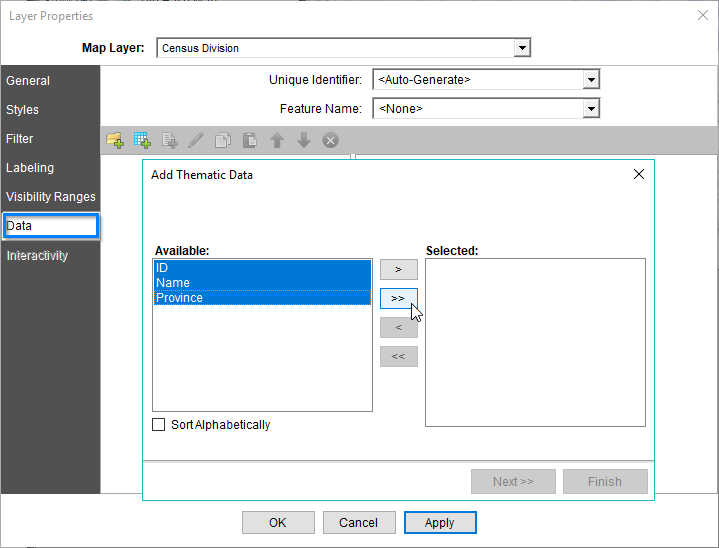
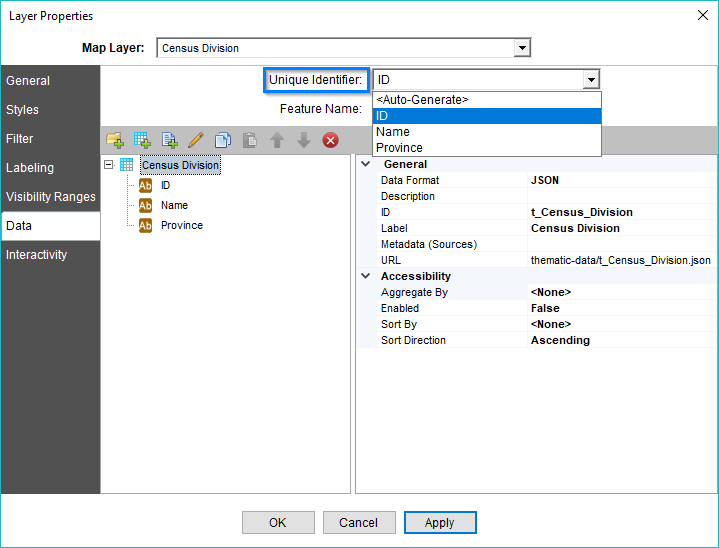
Layer Data
In the Data tab of the Layer Properties dialog, select the data of interest by dragging them from the left to the right section.
External Data
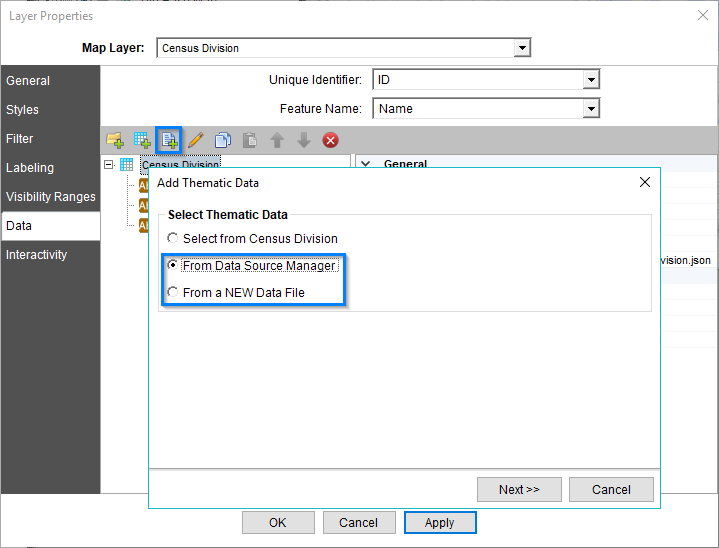
You can also add data from an external file, such as an Excel spreadsheet. To link the geographic layer to the thematic data, it is necessary to have a column in the map layer that contains the unique identifiers.
By clicking on the Add Thematic Data button, it will be possible to select data from the data sources manager. You can choose one of the files delivered with the CartoVista Publisher or add a new data file.
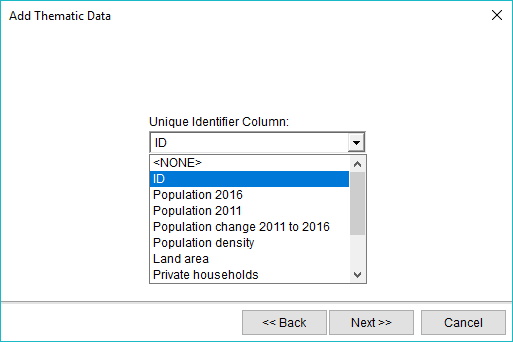
You must also define the column that contains the unique identifiers in this file to complete the binding.
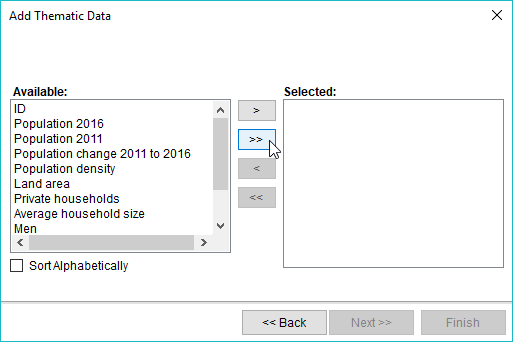
Select the data of interest by dragging them from the left to the right section.
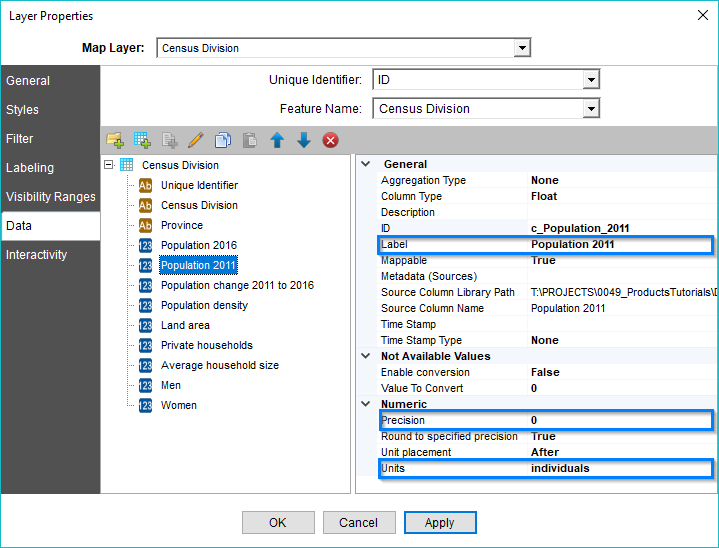
Data Settings
It is then possible to modify various parameters of the thematic data, such as the label, the precision and the units.
CartoVista Viewer
Publish your map. Your data is now available in the CartoVista Viewer. Click on the blue + and access your thematic data.
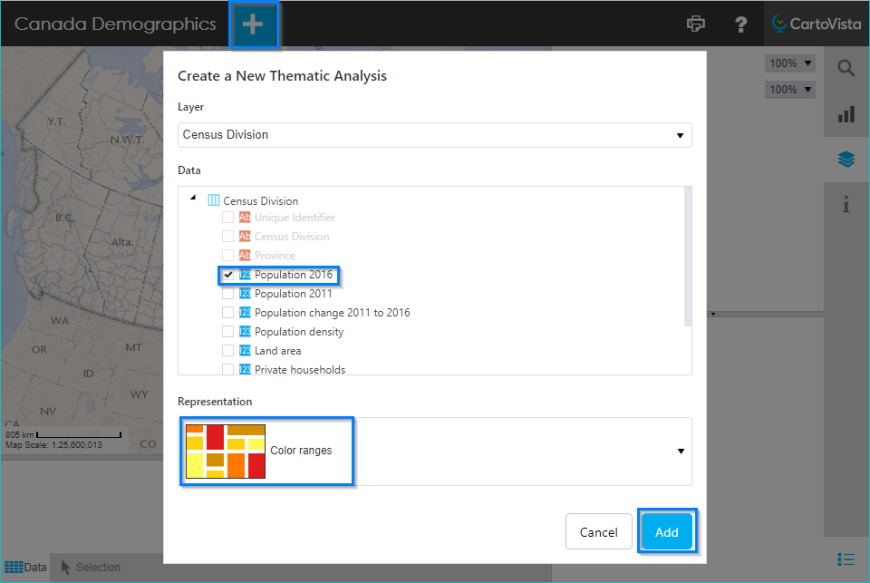
This tool allows you to create thematic analyses on the fly.
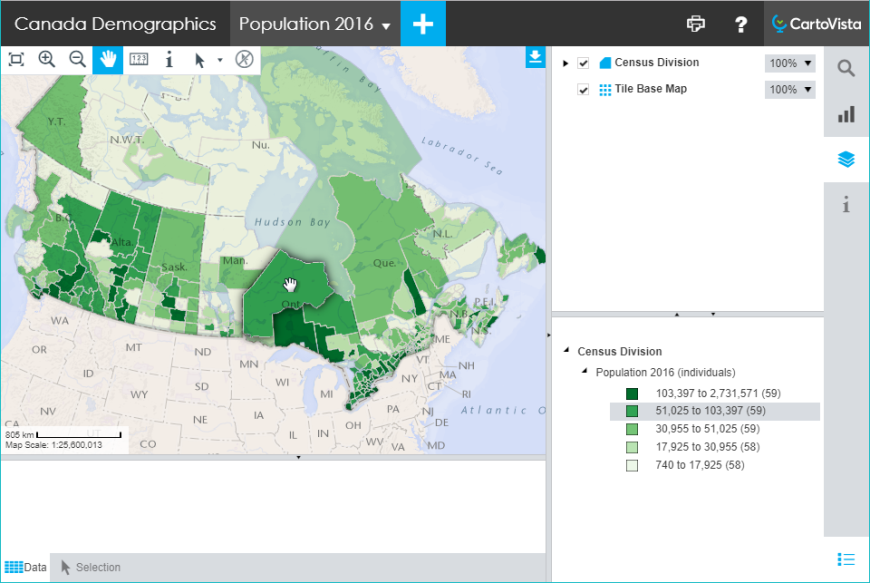
At this point, you have not yet given life to your data. It's possible to add interactivity to your map! For example, configure a data tip to be displayed when you mouse over map entities, a data table at the bottom of the map, and other interactive features available in the CartoVista Publisher.